I still remember the first time I showed my physics students a radar velocity scan. One kid leaned in, squinted at the red and green patches, and said, “So the storm is basically doing a treadmill test?” That is not a bad instinct. Doppler weather radar is, at its heart, a way to shine microwaves into the sky and measure two things at once: how much precipitation is out there (via returned power, shown as reflectivity) and whether that precipitation is moving toward or away from the radar (via Doppler velocity).
Those two measurements, shown on your favorite weather app as colorful maps, are why meteorologists can warn for flash floods, hail, and tornado potential even when the storm is still miles away.
The big idea
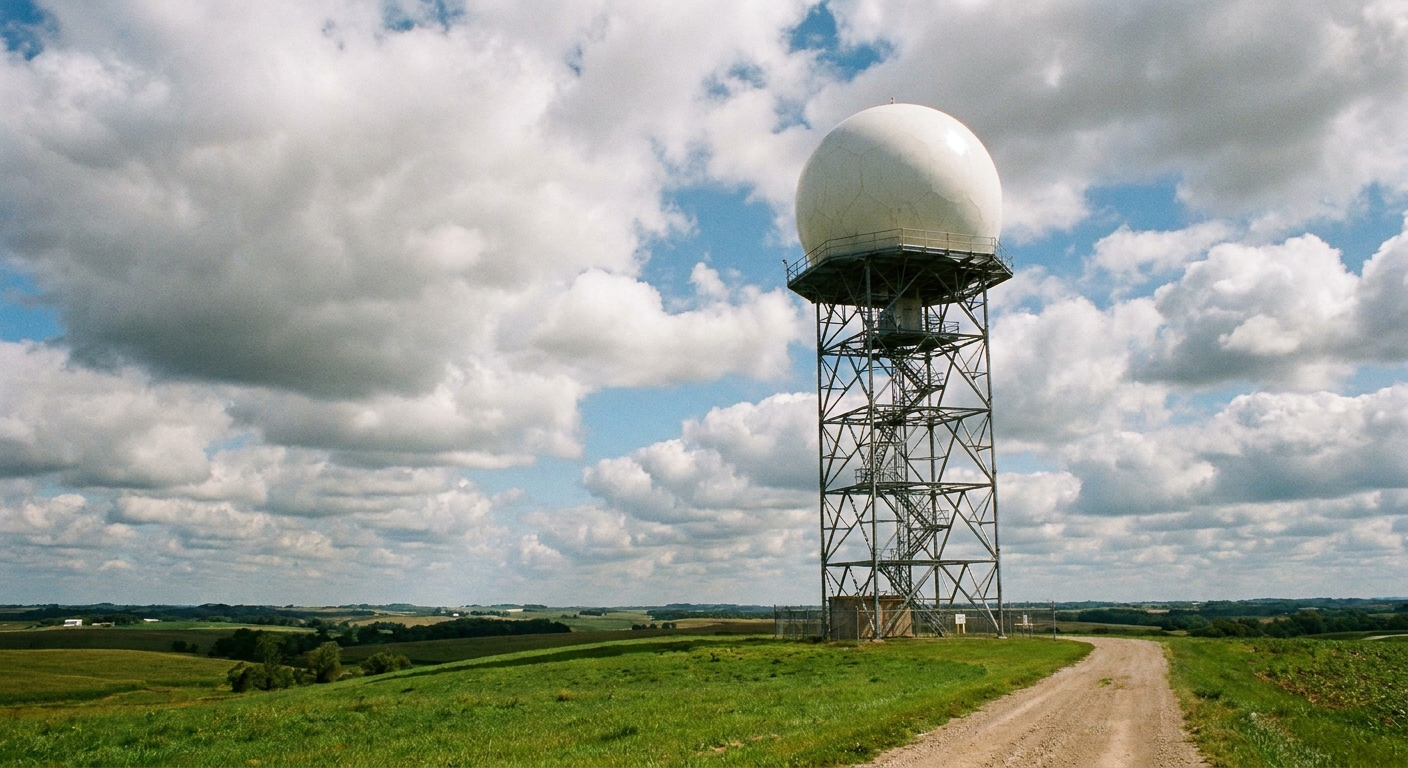
Radar stands for RAdio Detection And Ranging. Weather radars transmit pulses of microwave energy into the atmosphere. When those pulses hit something like raindrops, hailstones, or snowflakes, a tiny fraction of the energy scatters back to the antenna. The radar listens for that return signal, called an echo.
Two key clues are hidden inside that echo:
- How strong the echo is, which is related to how much precipitation is there and how big the particles are.
- How the returned signal changes from pulse to pulse. In practice, Doppler processing estimates the mean frequency shift and phase change between successive pulses (often called pulse-pair processing), which reveals motion toward or away from the radar.
If you have ever noticed a passing siren sounding higher as it approaches and lower as it leaves, you have experienced Doppler. Radar uses the same physics, but with microwaves and raindrops acting like millions of tiny moving reflectors.
What “Doppler” adds
A non-Doppler radar can tell you where echoes are and how strong they are. A Doppler radar can also estimate radial velocity, meaning the component of motion directly toward or away from the antenna.
That last phrase is crucial. Doppler weather radar does not measure the full wind vector in one shot. It measures one slice of the wind: along the beam line between the radar and the target. Winds blowing perfectly sideways relative to the radar beam can be “invisible” to velocity, even if they are strong.
This is why meteorologists often combine radar with surface observations, weather balloons, satellites, and storm reports. Each tool sees a different piece of the atmosphere.
How radar locates storms
Each radar pulse travels at (basically) the speed of light. The radar measures the time delay between transmitting a pulse and receiving the echo. Multiply that delay by the speed of light and divide by two, and you get distance.
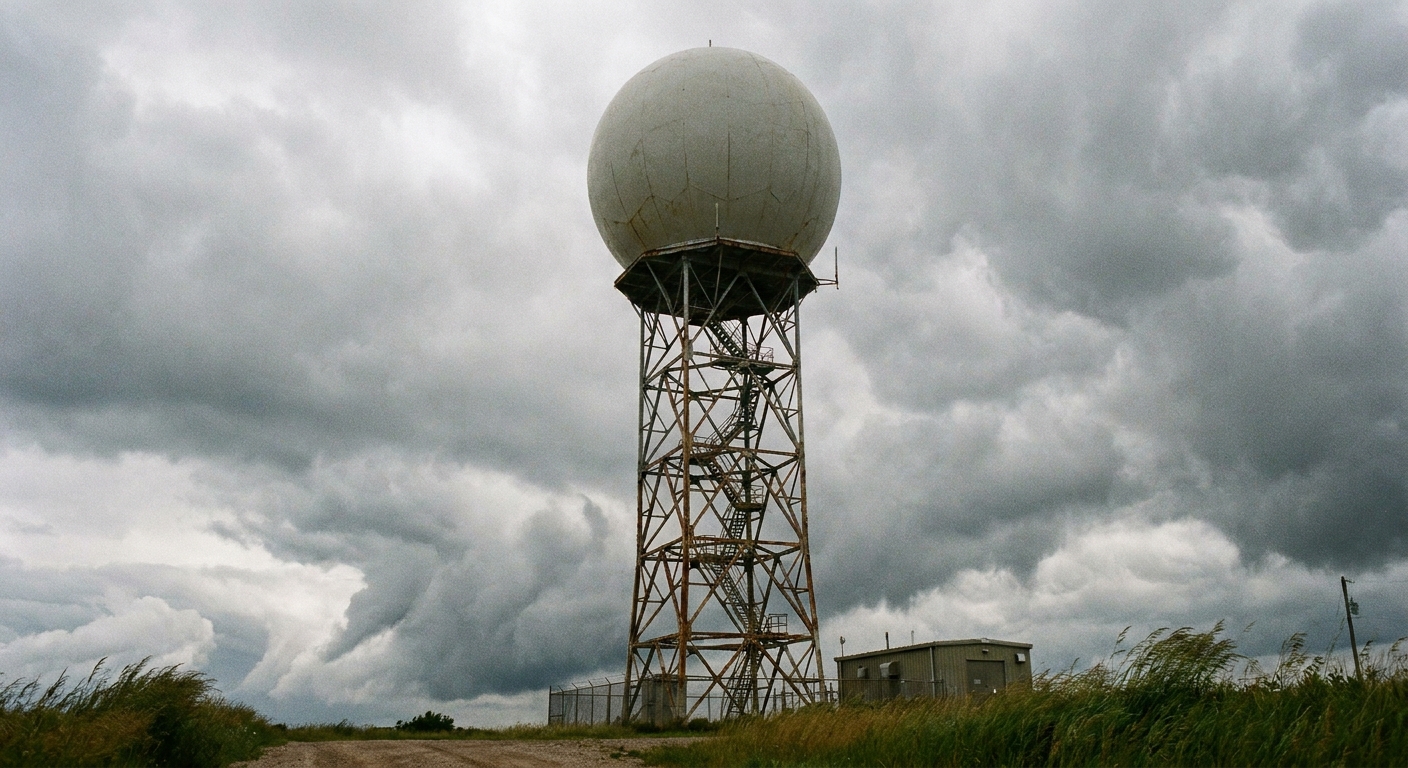
While it is doing that, the radar antenna also rotates and tilts through multiple angles, building a 3D sampling of the sky. In the United States, the best-known network is NEXRAD (often called WSR-88D), which performs repeated “volume scans” to refresh the picture of storms.
Reflectivity
The radar product most people recognize is reflectivity, usually shown as blues, greens, yellows, oranges, and reds. Reflectivity is commonly expressed in dBZ (decibels of Z), where Z is a measure related to returned energy.
Here is the everyday translation: higher reflectivity usually means heavier precipitation, but it can also mean larger particles (like hail) or a very high concentration of smaller drops. One reason big stuff matters so much is that, in simple terms, radar reflectivity is strongly weighted toward particle size (often summarized as Z being proportional to diameter to the sixth power). That is why hail can dominate the return even if it is mixed with rain.
How forecasters read it
- Light rain often shows up as widespread blues and greens.
- Moderate to heavy rain tends to appear as yellows and oranges, often in bands.
- Very intense cores can show up as deep reds or purples, which can mean torrential rain, hail, or both depending on storm type and temperature profile.
Reflectivity is fantastic for locating the “where” of precipitation. It is also the foundation for radar-estimated rainfall totals, which are important in flood forecasting. But reflectivity alone cannot tell you whether a storm is rotating or how winds are behaving inside it. That is where velocity comes in.
Base vs composite reflectivity
If you have ever seen a “composite” reflectivity map look scarier than what is happening at the surface, there is a reason. Base reflectivity comes from one elevation angle (often the lowest tilt, which is closest to the ground nearby). Composite reflectivity is closer to “the maximum reflectivity anywhere in the vertical column.” It is useful for finding the strongest part of a storm aloft, but it can exaggerate how intense conditions are at ground level.
Velocity
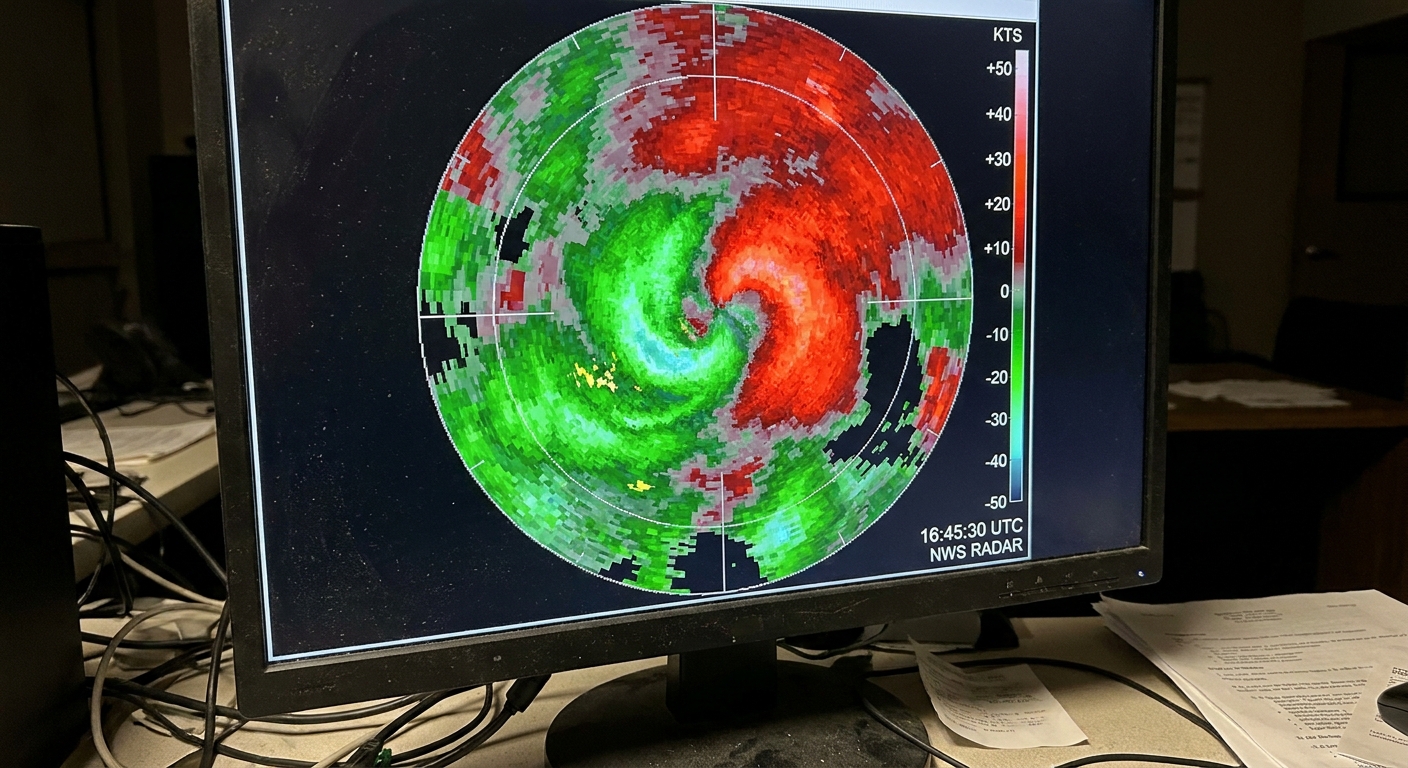
Velocity displays are often colored in two opposing hues (commonly greens and reds). One color indicates motion toward the radar, the other indicates motion away from it. The exact colors can vary by software, but the concept is always the same: you are looking at inbound and outbound motion along the radar beam.
Think of velocity like a speedometer that only works when the car is driving straight at you or straight away from you. If the car drives across your field of view, the speedometer reads near zero, even if the car is flying.
How rotation shows up
Rotation is not labeled with a big sign that says “TORNADO HERE.” Instead, meteorologists look for a tight, adjacent pairing of inbound and outbound velocities. If the winds are spinning, one side of the rotation is moving toward the radar while the other side is moving away.
When that inbound-outbound couplet is strong and compact, especially if it lines up with a storm structure that supports it, it can be evidence of a rotating updraft (a mesocyclone) and possible tornado development.
Common velocity pitfalls
- Aliasing (velocity folding): Radar can only measure velocity within a certain range for a given setup. If winds exceed that limit, the colors can “wrap around” and make very fast winds look like moderate winds in the opposite direction until software dealiases it.
- Range and beam height: Farther from the radar, the beam samples higher altitudes, so the velocity may represent winds well above the surface.
- Geometry: If the wind is mostly sideways relative to the beam, radial velocity will understate it.
Using products together
Operational forecasting is rarely about a single product. It is about context, and Doppler radar provides two of the most valuable context layers in real time.
A typical read might sound like this, translated into plain language:
- Reflectivity shows an intense core moving into a populated area, suggesting a burst of heavy rain or hail is likely soon.
- Velocity shows increasing inbound-outbound contrast near the core, suggesting strengthening rotation.
- The storm’s track, environment, and reports on the ground help decide whether to issue or upgrade warnings.
Reflectivity tells you where the “water and ice” are. Velocity tells you how the storm’s internal conveyor belts are moving relative to the radar.
Common signatures
Radar meteorology has its own vocabulary. A few terms show up often during severe weather coverage.
Hook echo
On reflectivity, a hook echo is a curved appendage that can appear on the backside of a supercell thunderstorm. It can indicate precipitation wrapping around a rotating updraft. Not every hook produces a tornado, and not every tornado has a classic hook, but it is one reason reflectivity is more than just “rain intensity colors.”
Tornado debris signature
When a tornado lofts debris, the best radar clue on modern NEXRAD is usually dual-polarization information, especially a drop in correlation coefficient (CC), sometimes paired with unusual reflectivity and a strong low-level velocity couplet. Forecasters treat this carefully and corroborate it with other evidence, but when it is clear, it can be a serious sign that damage may be occurring.
Velocity couplet
This is the inbound-outbound pairing on velocity that suggests rotation. Forecasters look at its strength, size, persistence, and how it lines up with storm structure.
What radar cannot do
Doppler radar is powerful, but it has limitations that explain some of the “Why didn’t radar see this?” moments during fast-changing weather.
It overshoots low-level features far away
Because Earth is curved and the radar beam is refracted slightly downward in a standard atmosphere, the beam still rises higher above the ground as range increases. Far from the radar, the beam may be sampling several thousand feet above the surface, missing low-level rotation or shallow precipitation.
It measures only radial wind
Velocity is toward-or-away. Winds blowing perpendicular to the beam can be underestimated or missed in that single view. Networks and multiple radars help, but the geometry always matters.
Non-weather echoes exist
Birds, insects, smoke, and even ground clutter can create echoes. Modern processing is good at filtering many of these, but artifacts still happen, especially near sunrise and sunset when biological targets are active.
Heavy precipitation can weaken the beam
Very heavy rain and hail can weaken the radar signal as it travels, which is called attenuation. This effect is generally less severe for S-band radars like NEXRAD than for shorter-wavelength C-band and X-band systems, but in the right storm it can still reduce what the radar can see behind the heaviest core.
Why it matters for warnings
Satellites are unbeatable for the big picture and for places without radar coverage, but radar is the tool that lets forecasters see storm-scale structure and motion inside the storm in near real time. When minutes matter for flash flooding or tornado potential, that internal motion view is priceless.
If climate data is the long, patient diary of our atmosphere, Doppler radar is the live video feed. Both are necessary. They just answer different questions.
Quick FAQ
Is Doppler radar the same as “rain radar” on my phone?
Most “rain radar” maps are visualizations of weather radar reflectivity, sometimes blended with other data. Your app is usually showing radar information, just processed and styled for quick viewing.
Do the colors always mean the same thing?
Not always. Different apps and TV stations use different color tables and scaling. The safest approach is to look for the legend and remember the core idea: higher reflectivity generally means heavier precipitation or bigger particles, and velocity colors show toward versus away motion.
Can radar see tornadoes directly?
Radar typically detects wind patterns that suggest rotation and, in some cases, debris aloft using dual-polarization variables. The tornado itself is a near-ground phenomenon, so confirmation still relies on spotters, damage surveys, and multiple data sources.
Why is the radar image sometimes “behind” the storm?
Radar updates take time to scan and process, and different products update on slightly different cycles. During rapidly evolving storms, even a few minutes can make the display feel behind what you see outside.