When I taught high school physics, I used to ask students to measure the same tabletop over and over with a ruler. Even if everyone tried their best, the numbers would spread out a little. Not because anyone was sloppy, but because real measurements come with uncertainty.
An ensemble weather forecast is the atmosphere’s version of that classroom exercise. Forecasters run a weather model many times, each run starting with tiny differences, and then they look at how much the answers spread out. That spread is not a bug. It is one of the most useful features in modern forecasting.

The basic idea
A standard forecast map you see online is often deterministic, meaning it comes from one primary run of one model: one set of starting conditions, one set of equations and parameter choices, one answer.
An ensemble forecast says: let’s not bet everything on one answer. Instead, we run many versions of the model, called members. Each member represents a plausible outcome given what we know now. The collection of all members is the ensemble.
Forecasters then ask two key questions:
- Where do the members agree? That is where confidence is higher.
- Where do they diverge? That is where uncertainty is higher, and small shifts could change impacts.
Why many runs beat one run
The atmosphere is chaotic in the scientific sense. Tiny differences now can grow into big differences later. That does not mean forecasting is hopeless. It means there is a practical horizon where uncertainty expands.
Here is the problem ensembles are designed to handle:
- We never know the exact state of the atmosphere everywhere at once. Observations are incomplete and noisy.
- Models approximate physics. They cannot resolve every cloud droplet, hilltop gust, or thunderstorm updraft directly.
If you run a model from one best estimate of the current atmosphere, you get one future. But the real world might be starting from a slightly different set of plausible initial states than your estimate. Ensembles sample those plausible starting points and show you how sensitive the forecast is.
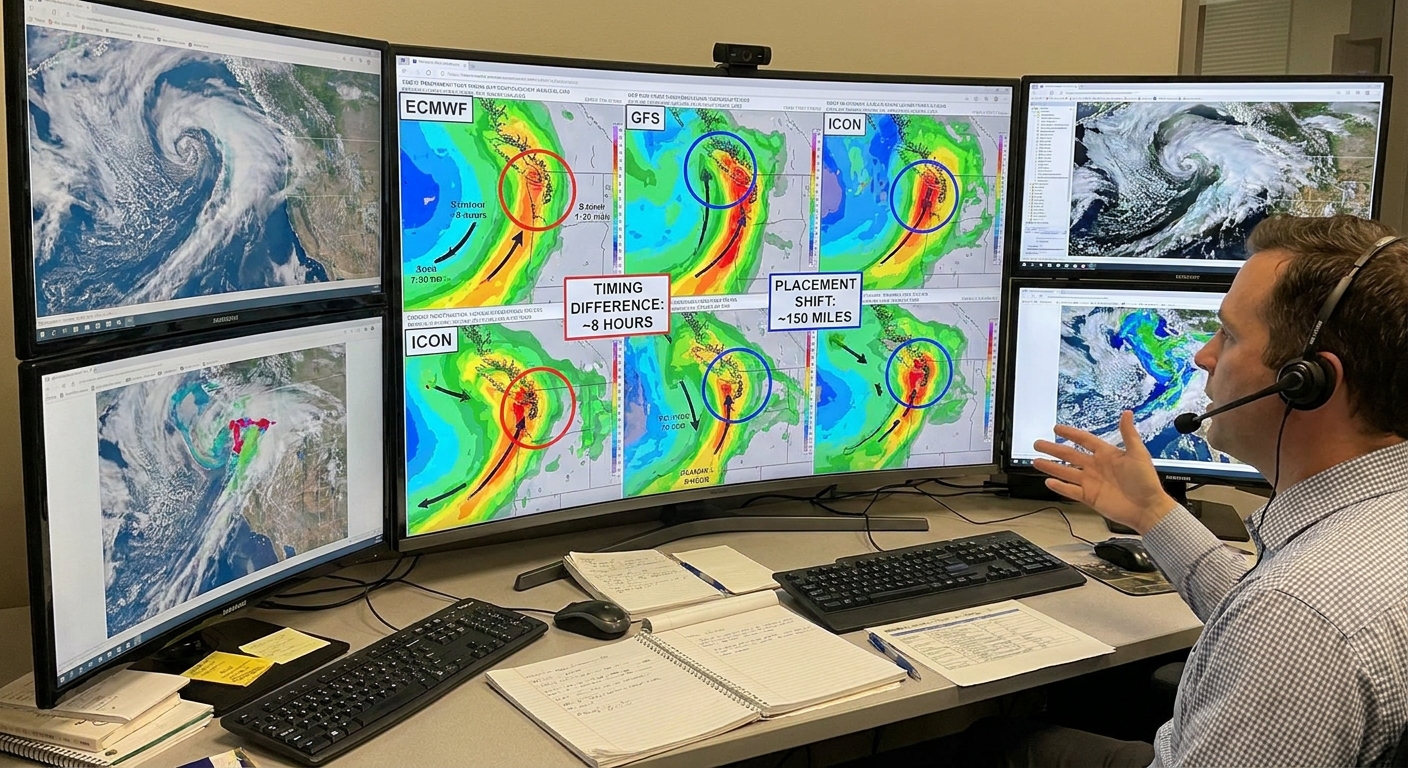
One practical note from the forecasting desk: ensembles tend to earn their keep most beyond the next few days, when small errors have had time to grow. At very short lead times, high-resolution deterministic guidance can still be extremely useful, especially for local details like storms and terrain-driven winds.
How ensembles are made
1) Small tweaks to the starting state
One common method is to create slightly different initial conditions. Think of it as nudging temperatures, winds, pressure, or humidity within the range that observations could reasonably allow. Each ensemble member begins from one of those nudged starting states.
2) Small differences in model setup
Another approach is to vary aspects of the model itself, especially processes too small to simulate directly. For example, different assumptions about how clouds form, how turbulence mixes air, or how the land surface exchanges heat and moisture can be used to create a family of plausible outcomes.
3) Multi-model ensembles
Sometimes an ensemble is built by combining outputs from different models run by different centers. This adds diversity because models have different strengths and weaknesses.
That said, plenty of operational ensembles are single-model systems that generate diversity through perturbed initial conditions and model physics. Multi-model is one useful flavor, not the definition.
What the spread tells you
If you only remember one sentence, make it this: spread is a proxy for uncertainty.
Tight clustering means higher confidence
If 30 out of 30 ensemble members predict a cold front arriving Tuesday afternoon, that timing is relatively stable. The atmosphere still might surprise us, but the forecast is not especially sensitive to small starting changes.
Wide spread means lower confidence
If members range from “front arrives Tuesday morning” to “front stalls until Wednesday,” the situation is sensitive. Small changes now are cascading into big timing differences.
Member counts give a first-pass probability
A really practical perk is that ensembles can turn “uncertainty” into a usable, numbers-on-the-table estimate:
- If 8 of 40 members produce at least 1 inch of rain at your location, that is roughly a 20 percent chance in that raw model ensemble.
- If 32 of 40 members bring measurable rain, that is roughly 80 percent.
But it is important to say this clearly: raw member counts are a first-pass estimate, not automatically a perfectly calibrated probability. Ensembles can share biases, and many are underdispersive, meaning the real world lands outside the spread more often than it should. In practice, forecasters often improve reliability with calibration and post-processing, such as model output statistics and ensemble methods that adjust bias and spread.
How to read ensemble graphics
Spaghetti plots
A spaghetti plot overlays many contour lines from many ensemble members, often for something like pressure patterns or the position of a front aloft.
- Lines tightly bunched: strong agreement, higher confidence.
- Lines tangled and scattered: disagreement, lower confidence.
Plumes and meteograms
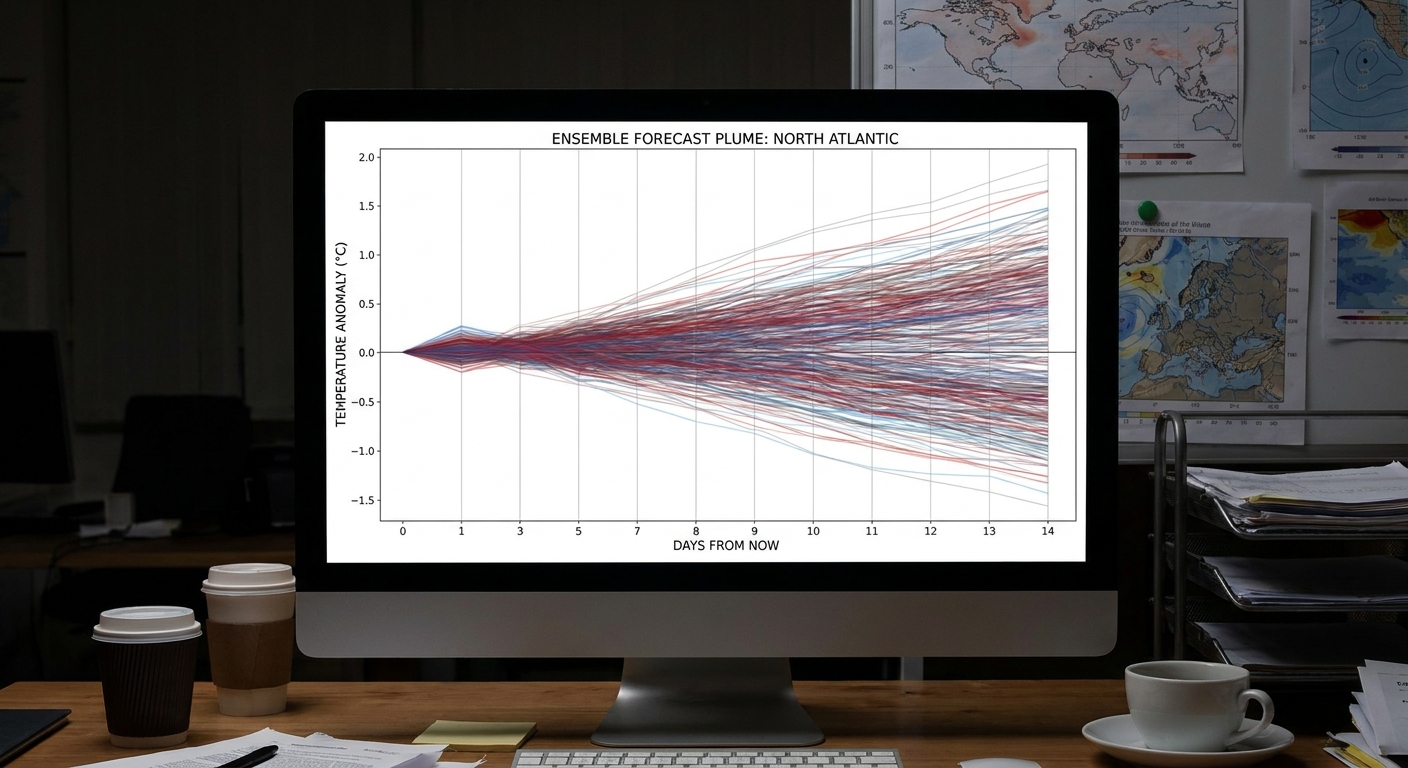
A plume plot tracks a forecast variable over time at one location, such as temperature, wind speed, or precipitation. Each line is one ensemble member.
This is where the word “spread” becomes visual:
- If the lines stay close, the forecast is stable.
- If the lines fan out, uncertainty grows.
Mean, median, and clusters
Beyond spread, you will often see a few other ensemble summaries:
- Ensemble mean: the average of all members. It is useful for large-scale patterns, but it can smooth out extremes.
- Ensemble median: the middle member when outcomes are ranked. It can be less sensitive to outliers than the mean.
- Clusters: sometimes the members do not form one fuzzy cloud, they form two or three groups. That is a clue the atmosphere may be deciding between distinct scenarios, such as “storm tracks north” versus “storm tracks south.”
Ensemble hurricane tracks and the cone
During hurricane season you will often see a “plume” of possible storm tracks generated from ensembles. That plume is a forecast tool: many modeled paths based on slightly different starts or model choices.
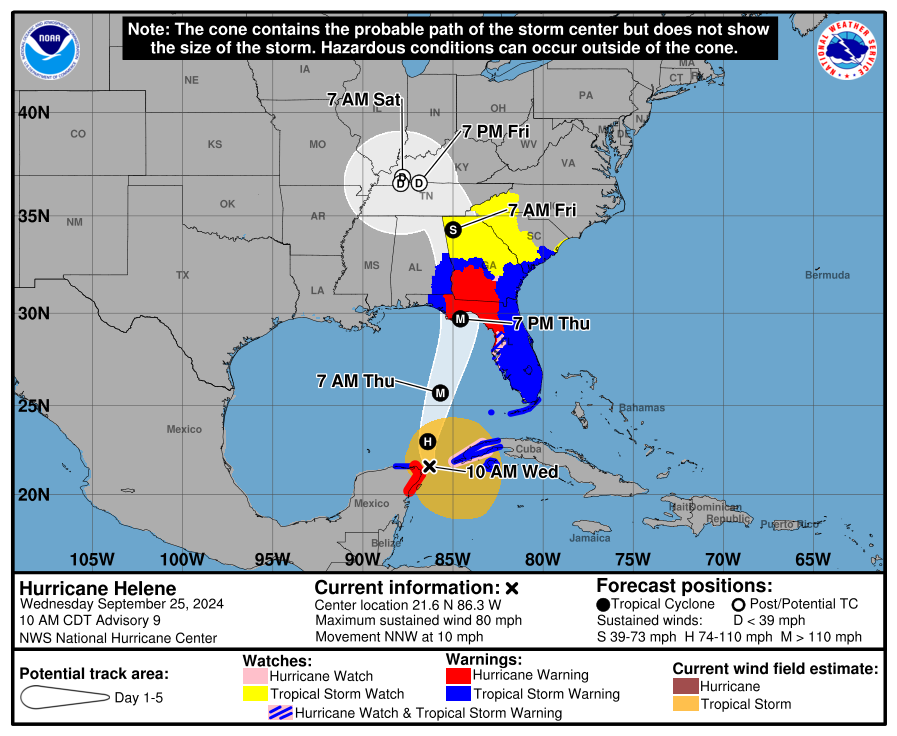
The familiar hurricane cone, by contrast, is a different kind of graphic. In the United States, the National Hurricane Center cone is built from historical official forecast track errors, expanding outward with time. It shows where the storm center has often ended up in the past given similar forecast lead times. It is not the same thing as plotting a bunch of ensemble members, even though both visuals communicate uncertainty.
One more reminder I wish every coastal resident heard: impacts can occur well outside a cone because hazards like rain, storm surge, and tornadoes extend far from the center.
Why ensembles still miss
Ensembles do not magically remove forecast errors. They make uncertainty visible. A few reasons ensembles can still struggle:
- Shared bias: if all members use similar physics, they can be wrong in the same direction.
- Underdispersion: sometimes the ensemble spread is too small, meaning reality falls outside the range more often than it should.
- Hard problems: convection and thunderstorms, rapid intensification in tropical cyclones, and complex terrain winds are notoriously tricky.
A good ensemble is not just sharp, meaning narrow spread. It is also reliable, meaning the spread matches typical error. In other words, when the ensemble says “high confidence,” it should usually be right for the right reasons.
Using ensembles day to day
If you are not a meteorologist, you do not need to stare at 50 squiggly lines to get value from ensembles. Here are a few practical translations:
- Low spread (members agree): it is safer to lock in plans. The forecast is less sensitive.
- High spread (members disagree): build flexibility. Think “plan A, plan B,” especially for travel, outdoor work, or event planning.
- Watch thresholds: ask “What fraction of members cross a meaningful line?” For example, freezing temperatures, wind gusts above 40 mph, or rain above 1 inch.
- Look for clusters: if you see two camps of solutions, plan for the impacts of both until one camp clearly wins out.
Ensemble forecast FAQs
Is an ensemble forecast more accurate than a regular forecast?
Often, yes, especially when you use it the right way. Ensembles can improve accuracy by highlighting the most likely outcomes and by preventing overconfidence. Even when the “best” single map looks great, the ensemble might reveal it is a fragile solution.
What does it mean when models flip from run to run?
If a forecast changes a lot between updates, it usually signals sensitivity. Ensembles help diagnose that. If the spread is wide, flips are more likely because small updates to observations can push the model toward a different cluster of outcomes.
How many members are in an ensemble?
It depends on the forecasting center and the ensemble system. Some have a few dozen members, some more. More members can sample uncertainty better, but computing power and time always matter.
What is the ensemble mean?
The ensemble mean is the average of all members. It is useful for large-scale patterns, but it can smooth out extremes. For example, averaging a few members with heavy rain and many members with little rain can produce a moderate rain signal that no member actually predicts.
What is the control run?
Many ensembles include a control member that uses the best estimate initial conditions without the extra perturbations. It is like a baseline to compare against the perturbed members.
The takeaway
A single deterministic forecast is one story about the future atmosphere. An ensemble forecast is a bookshelf of plausible stories, all starting from almost the same present. The tightness or spread of those stories is one of the best real world indicators we have for forecast confidence.
Next time you see a plume of hurricane tracks or a fan of temperature lines, try this simple read: Are they clustering or scattering? That one glance can tell you as much as any single colorful map.