The first time I taught hurricane forecasting in a classroom, I watched a familiar misunderstanding spread faster than a rumor before prom: students saw the “cone of uncertainty” and assumed the storm itself would fill that whole shape. It is an easy mistake to make because our brains treat shapes as objects.
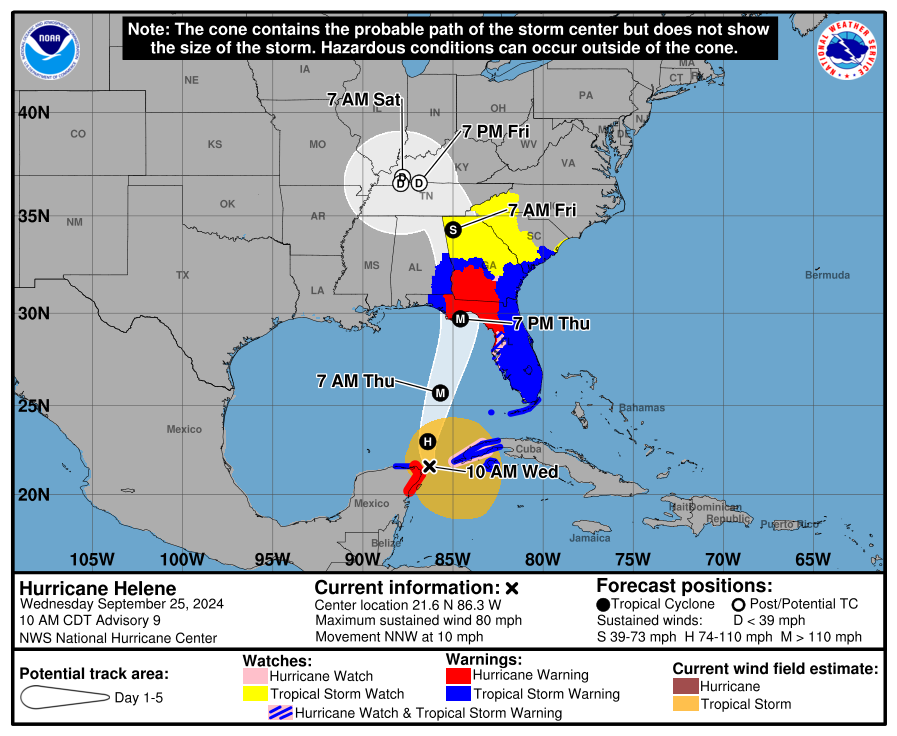
But the hurricane cone is not a picture of the storm. It is a picture of where the center of the storm might go.
What the cone is
The cone of uncertainty is a region drawn around the forecast track of a hurricane’s center, based on recent historical official track errors for that forecast lead time.
Think of it like tossing a paper airplane: you can predict the direction, but even with a good throw there is a spread in where it might land. The cone is that spread, based on how forecast “throws” have gone historically.
How the cone is built
Forecast centers like the National Hurricane Center (NHC) and Central Pacific Hurricane Center (CPHC) start with an official forecast track, often shown as a line with points for future times (commonly 12, 24, 36, 48, 60, 72, 96, and 120 hours).
Around each time point, they draw a circle whose radius is based on average track errors from recent years at that lead time. Those circles are then connected, creating the familiar widening cone shape.
- Short-range forecasts tend to be more accurate, so the cone starts narrow.
- Longer-range forecasts have more uncertainty, so the cone widens with time.
This means the cone is not “made bigger” because the storm is intensifying, or “made smaller” because it is weakening. It is not storm-specific. It is built from how official track forecasts have performed, on average, at each time horizon.
One more detail most people never hear: the cone’s size is recalculated periodically as forecast skill changes over time. That is another reason it should never be read as “this particular storm is getting less predictable.”
What it means to be inside the cone
The official NHC/CPHC cone is designed so that, historically, the hurricane’s center has fallen within the cone about two-thirds of the time (roughly 67%) at each forecast lead time.
That wording matters. It is a statistical statement across many past storms at each time point, not a promise that one specific storm’s center will stay inside the cone continuously for the next five days.
Two important consequences follow:
- Inside the cone is not a guarantee. About one-third of the time, the center ends up outside the cone at a given lead time.
- Outside the cone is not “safe.” It only means the center is less likely to pass directly overhead, not that impacts will miss you.
If you live near the edge, plan for impacts as if the track could shift toward you. A small shift can move the strongest effects dramatically, especially for wind direction and storm surge on certain coastlines.
What the cone does not show
Here is the misconception I run into the most: people assume the cone shows the hurricane’s footprint. It does not.
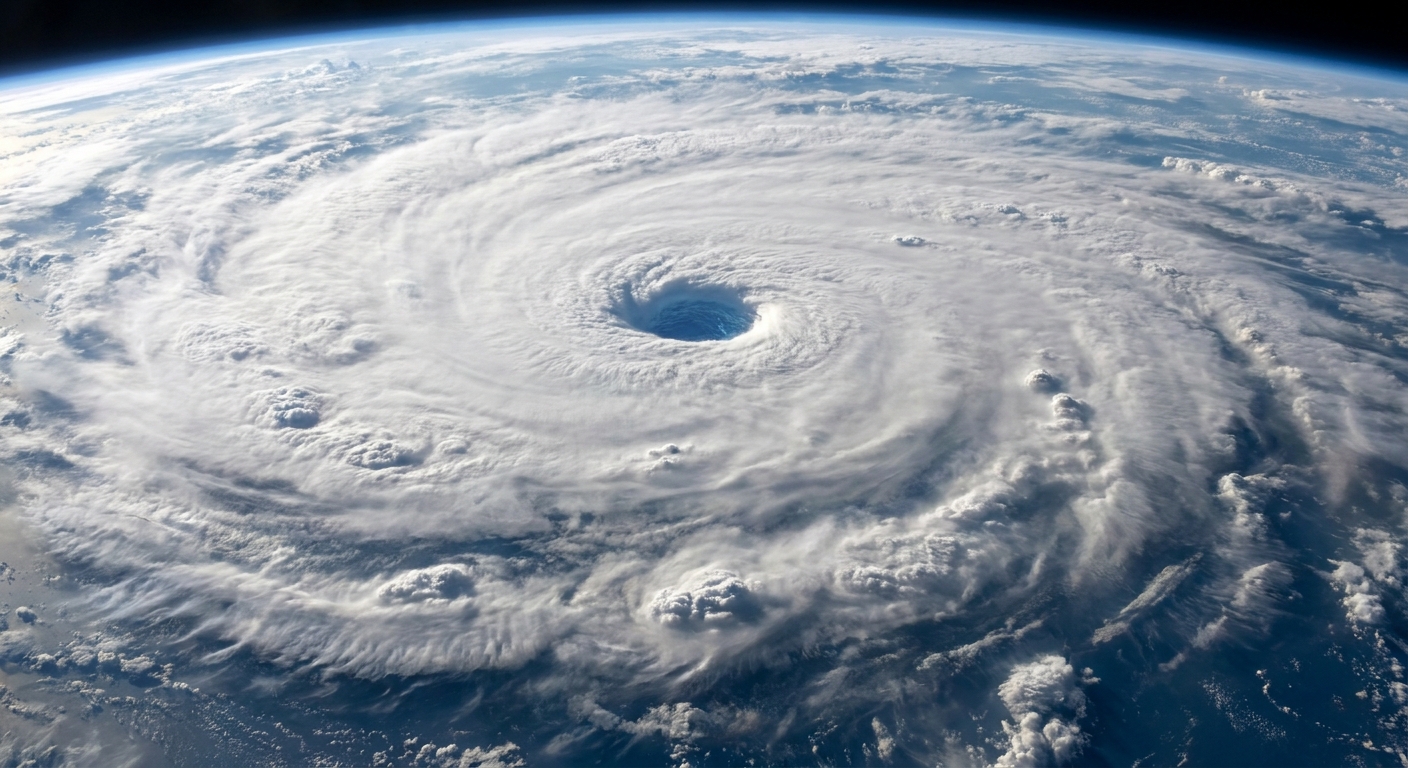
The cone only describes uncertainty in the track of the center. Hurricanes can have tropical-storm-force winds extending hundreds of miles from the center, and rain bands can reach even farther.
It also does not show intensity uncertainty. A storm can end up stronger or weaker than forecast even if the track verifies well.
So if the cone looks like it misses your town, you can still get:
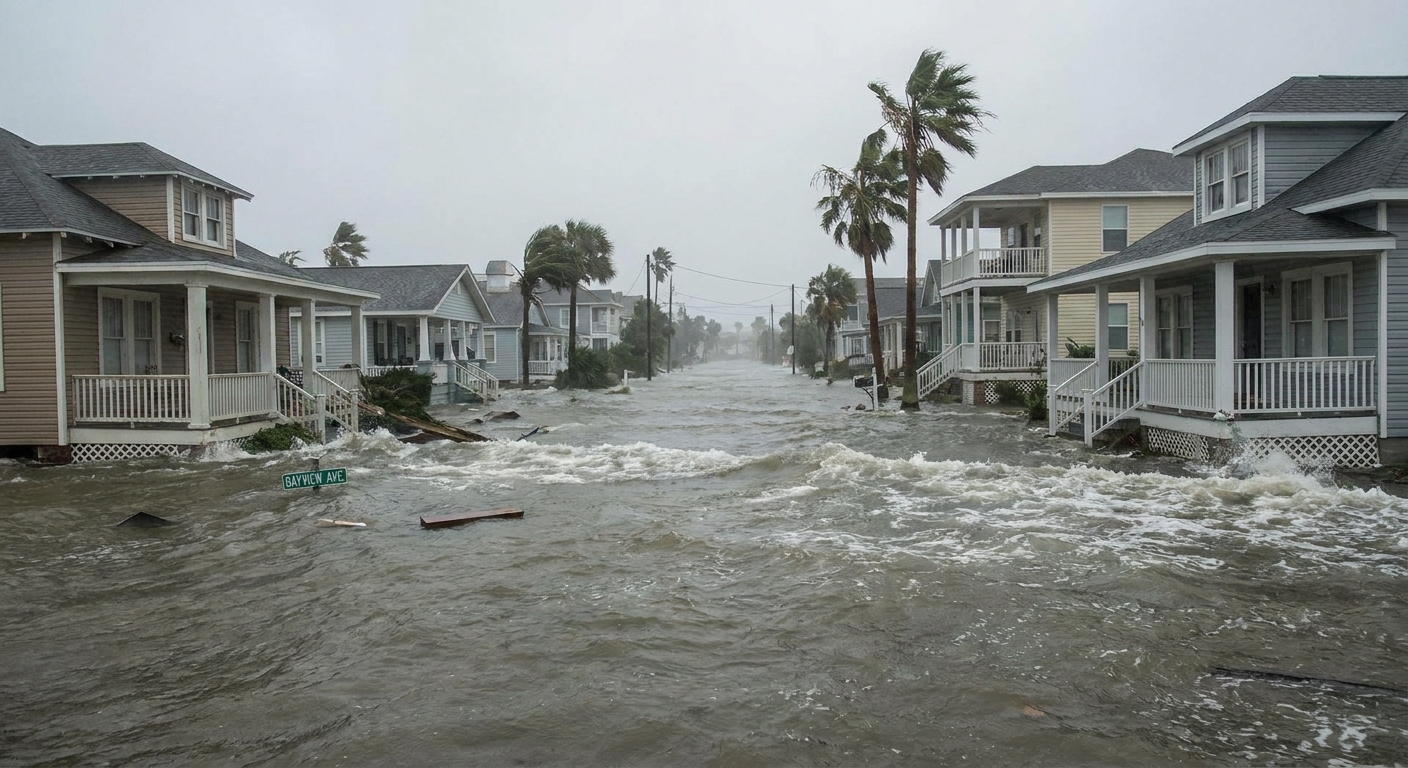
- Damaging wind from the outer circulation.
- Torrential rain well away from the center, sometimes on the “drier” side too.
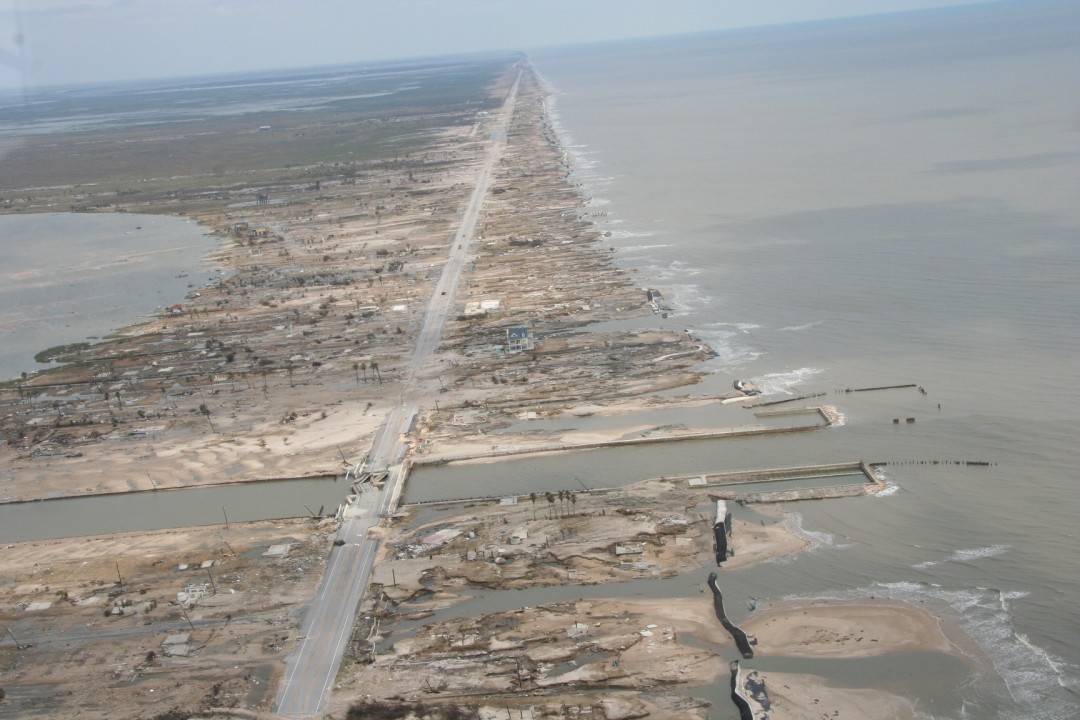
- Storm surge that depends on coastal shape and wind direction, not just distance from the center.
- Tornadoes embedded in rain bands, often far from landfall.
Why hazards extend beyond the cone
Wind
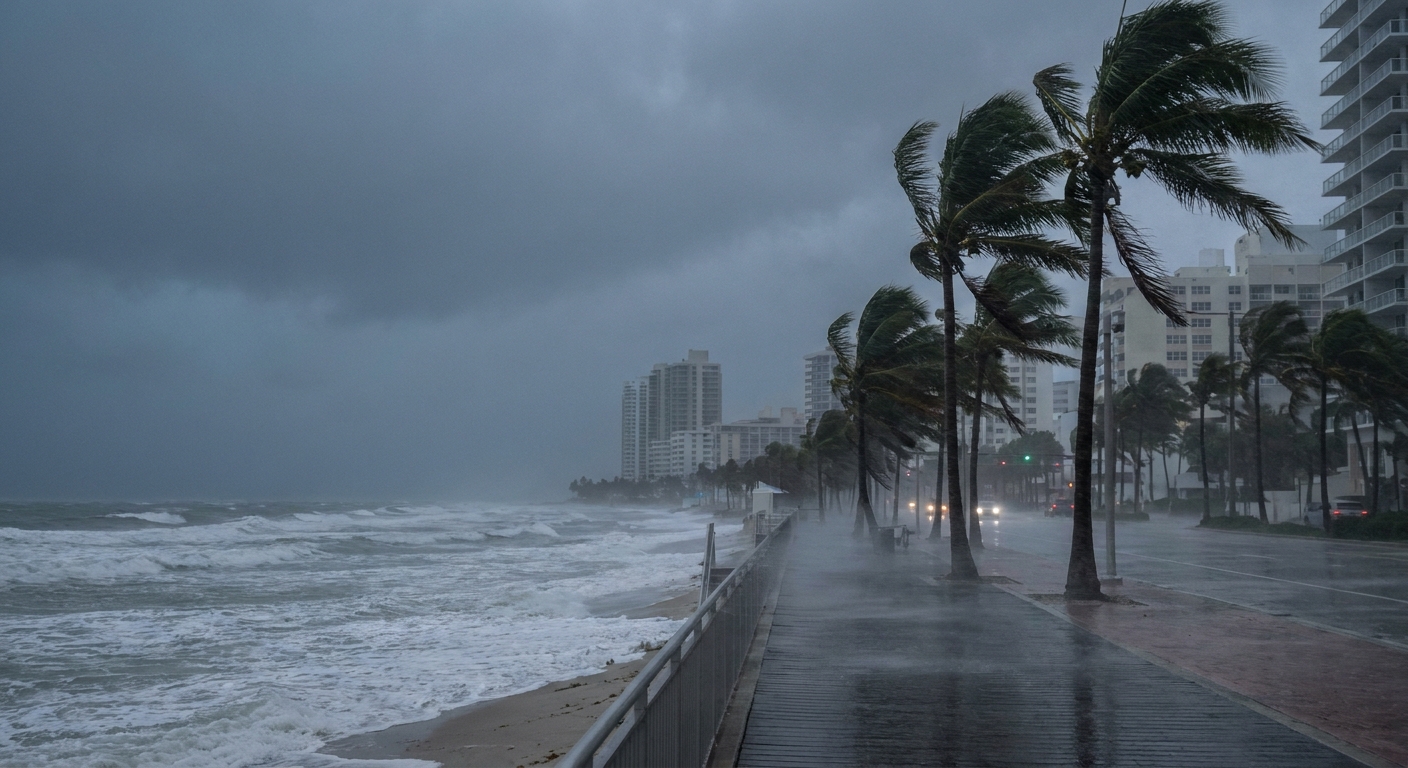
Wind risk is about more than “how close is the center.” A large hurricane can deliver tropical-storm-force winds far from the eye. Also, where you sit relative to the storm’s motion matters. One side of the storm often has stronger winds because the storm’s forward speed adds to the rotational wind.
And practically speaking, those winds can arrive hours before the forecast point where the center is expected to be nearest you.
Rain
Rainfall can pile up in places that are nowhere near the eventual landfall point. Topography, slow storm motion, and interactions with other weather systems can all wring out water. Flooding deaths in tropical systems are often tied to rainfall and inland flooding, not just coastal impacts.
Storm surge
Storm surge is driven by wind pushing water toward shore, plus the shape of the coastline and seafloor. A modest track shift can change which bays and inlets get water funneled into them.
Surge watches and warnings are drawn from surge risk and local forecast judgment, not from the cone boundary. It is common for warning areas to extend beyond the cone because impacts do.
How to read the cone
If you want a quick, reliable routine, this is the one I use when I check advisories.
1) Start with the track line
The line through the middle is the official forecast track, the forecasters’ best estimate of where the center will go. Use it to understand general direction and timing, but do not stop there.
2) Note your distance to the cone edge
Being near the edge means you are close enough that a small wobble or a forecast adjustment can put you under the core impacts.
3) Pull up hazard maps
For decisions, prioritize products that map hazards directly: wind probabilities, rainfall forecasts, storm surge inundation maps, and local watches and warnings. The cone is the headline. The hazard layers are the fine print that actually matters.
4) Treat time points as approximate
Those forecast points are not appointments. Conditions can deteriorate earlier than the plotted time, especially as outer bands and tropical-storm-force winds arrive.
Common mistakes
- Myth: “If I’m outside the cone, I’m in the clear.”
Fix: You can still see dangerous wind, rain, tornadoes, and surge outside the cone. - Myth: “The cone shows how wide the storm is.”
Fix: The cone shows uncertainty in the center track, not storm size. - Myth: “The storm will fill the cone by Day 5.”
Fix: A widening cone reflects increasing track uncertainty with time, not storm growth. - Myth: “The middle line is what will happen.”
Fix: It is the official best estimate at that moment, and it can shift as new data arrives.
What to do with the cone
Use the cone as a first pass for “what region should pay close attention,” then switch to hazard-focused information for real choices. If you are anywhere near the cone, or anywhere along a coastline that could plausibly see onshore winds, it is smart to review local guidance and prep timelines early.
And if you remember just one line, make it this: the cone is about where the center might go, not where impacts will be.
FAQ
Does the cone mean the storm is getting bigger?
No. The cone gets wider mainly because track uncertainty increases the farther out you look. It is not a measure of the storm’s physical size.
Why do forecasts shift from update to update?
Because new observations come in and models rerun. Small changes in steering winds can produce noticeable track differences, especially several days out.
If the cone is about two-thirds coverage, why do some storms miss it?
Because two-thirds is not all. The cone is built from historical averages, and the atmosphere sometimes serves up unusual setups where errors are larger than typical.
What should I look at besides the cone?
Wind probabilities, rainfall forecasts, storm surge products, and local watches and warnings. Those are the tools designed to translate track uncertainty into real-world risk.