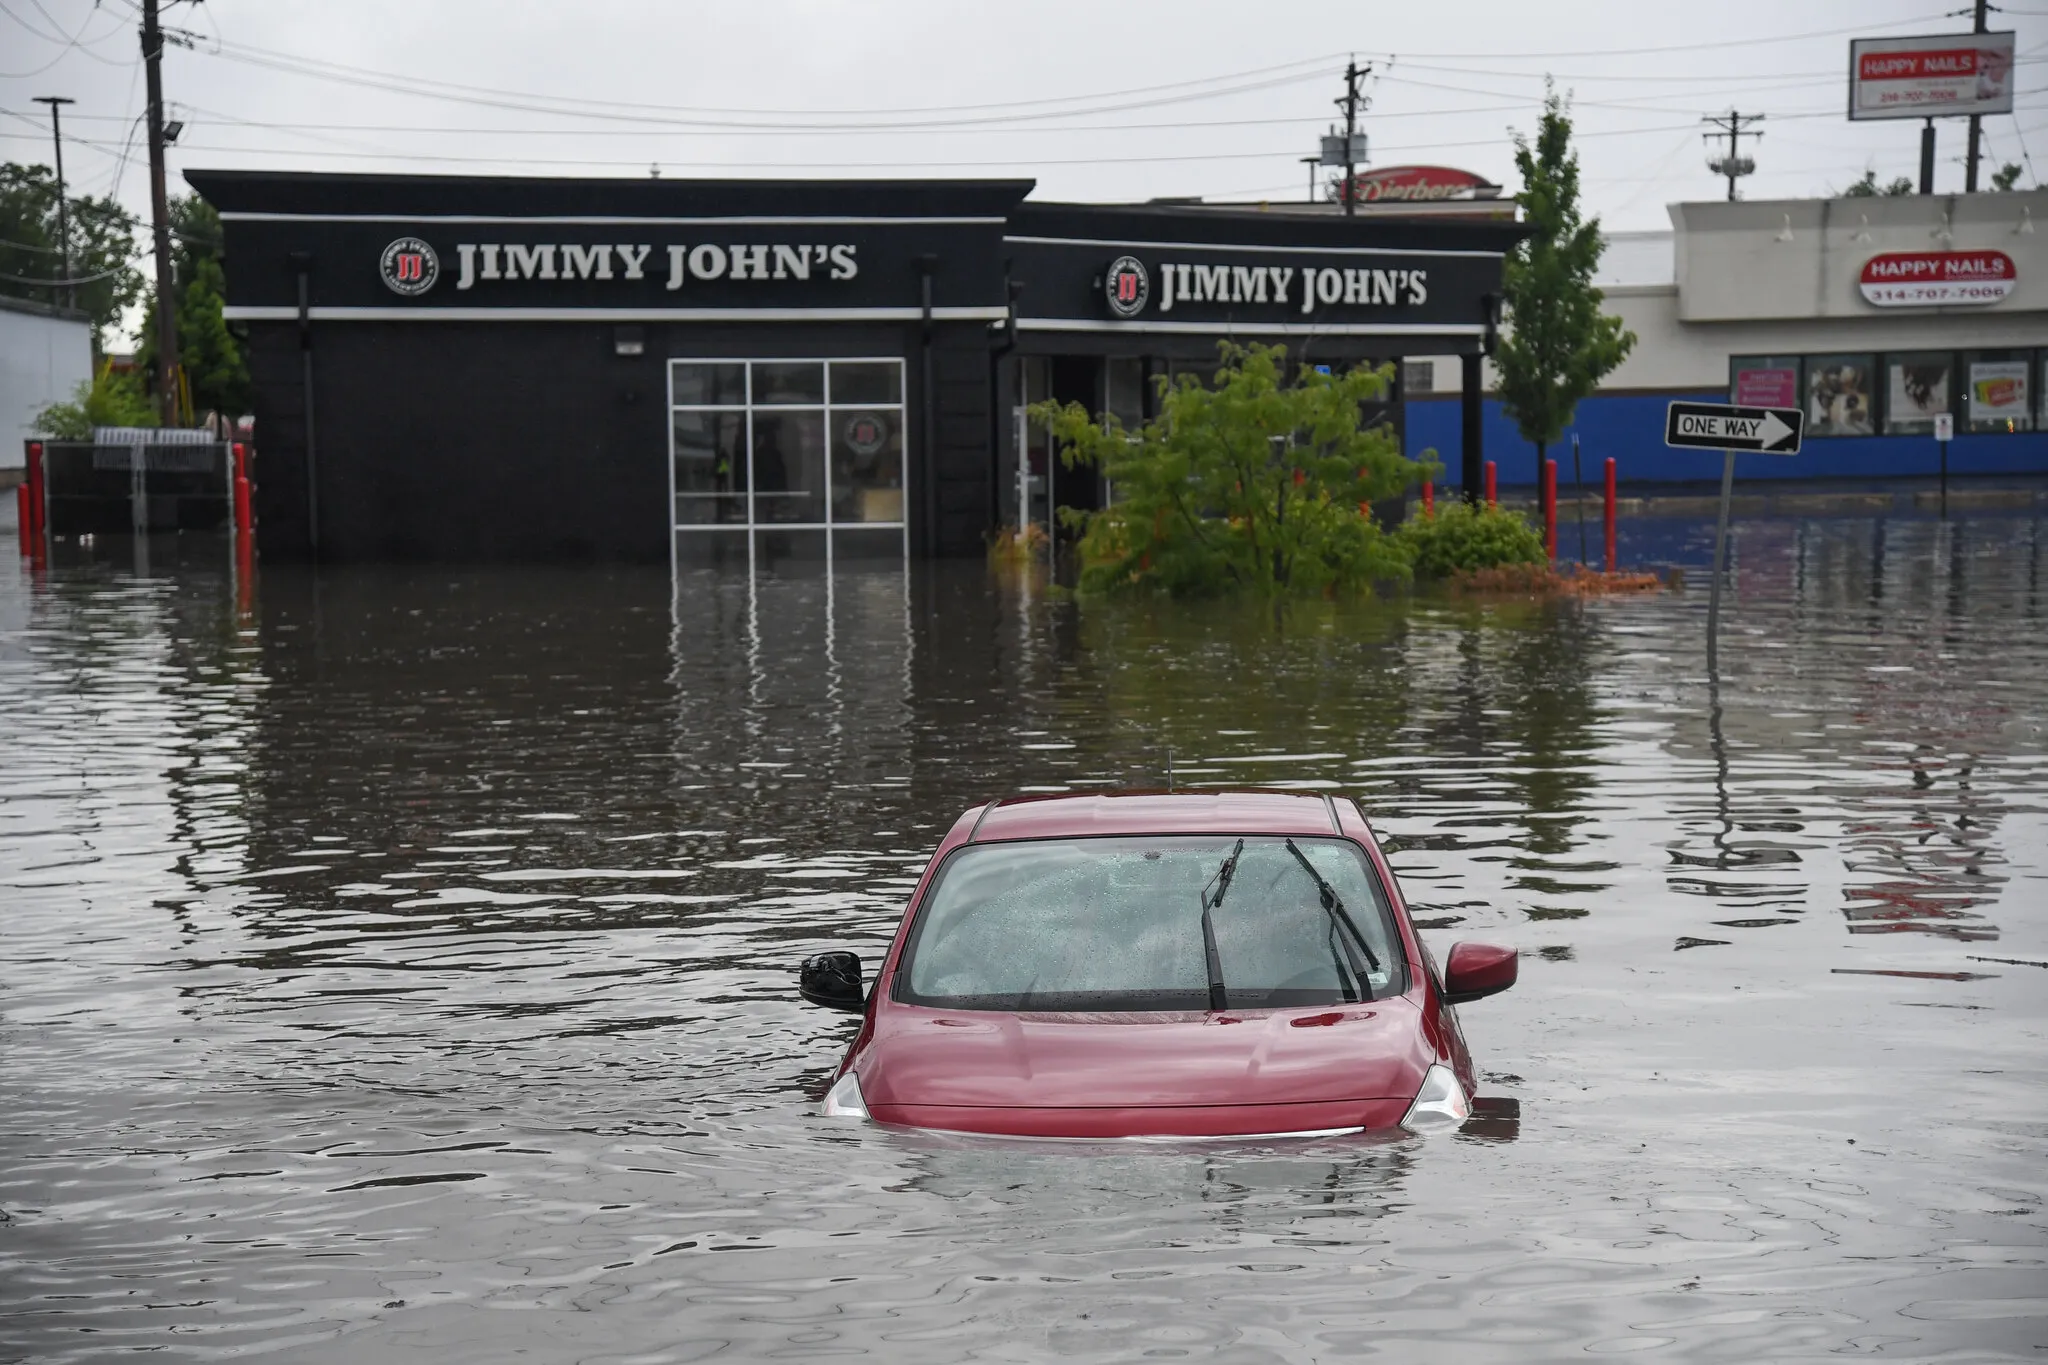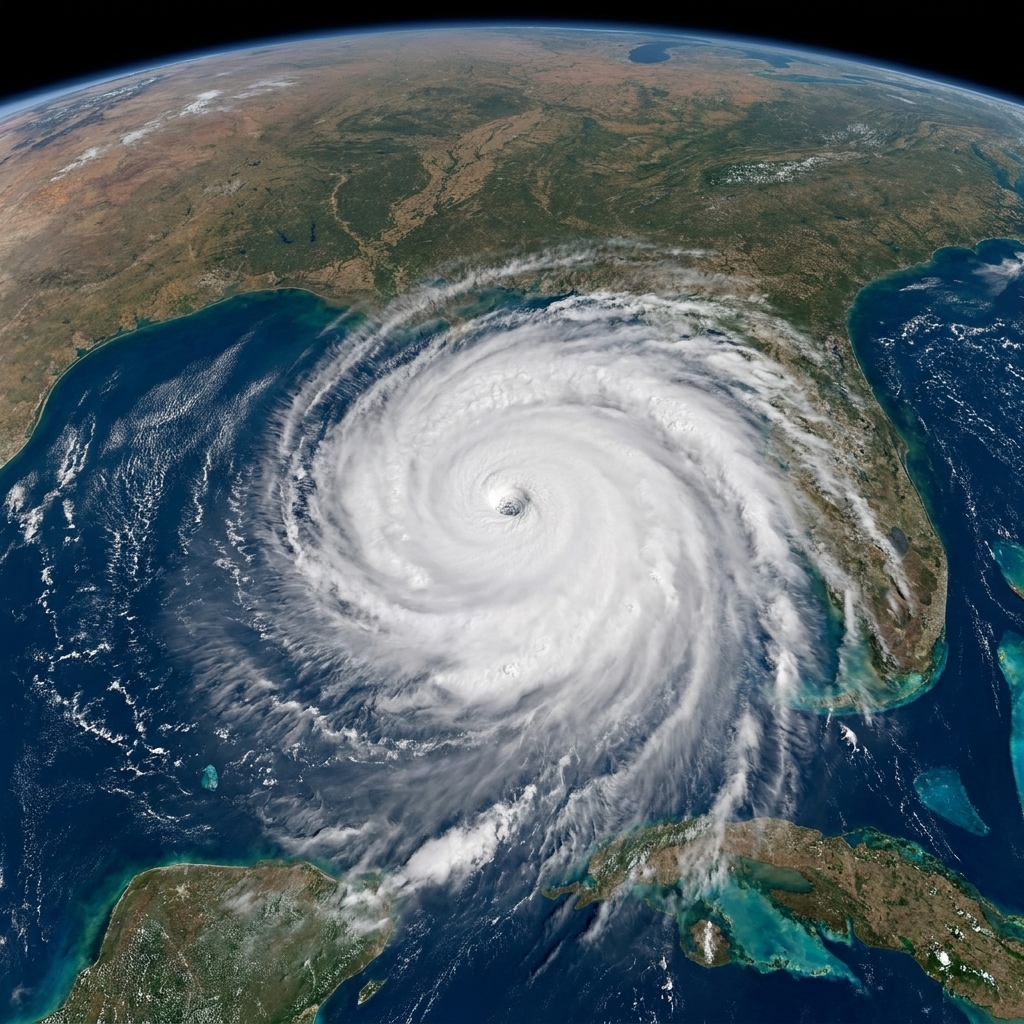
When I taught physics, one of my favorite classroom moments was watching students realize that chance does not care about our intuition. A coin can land on heads five times in a row, not because it is “due” for tails, but because randomness has no memory.
The phrase “100-year flood” trips people up for the same reason. It sounds like a calendar appointment: a big flood that shows up once per century. In reality, it is a probability label.
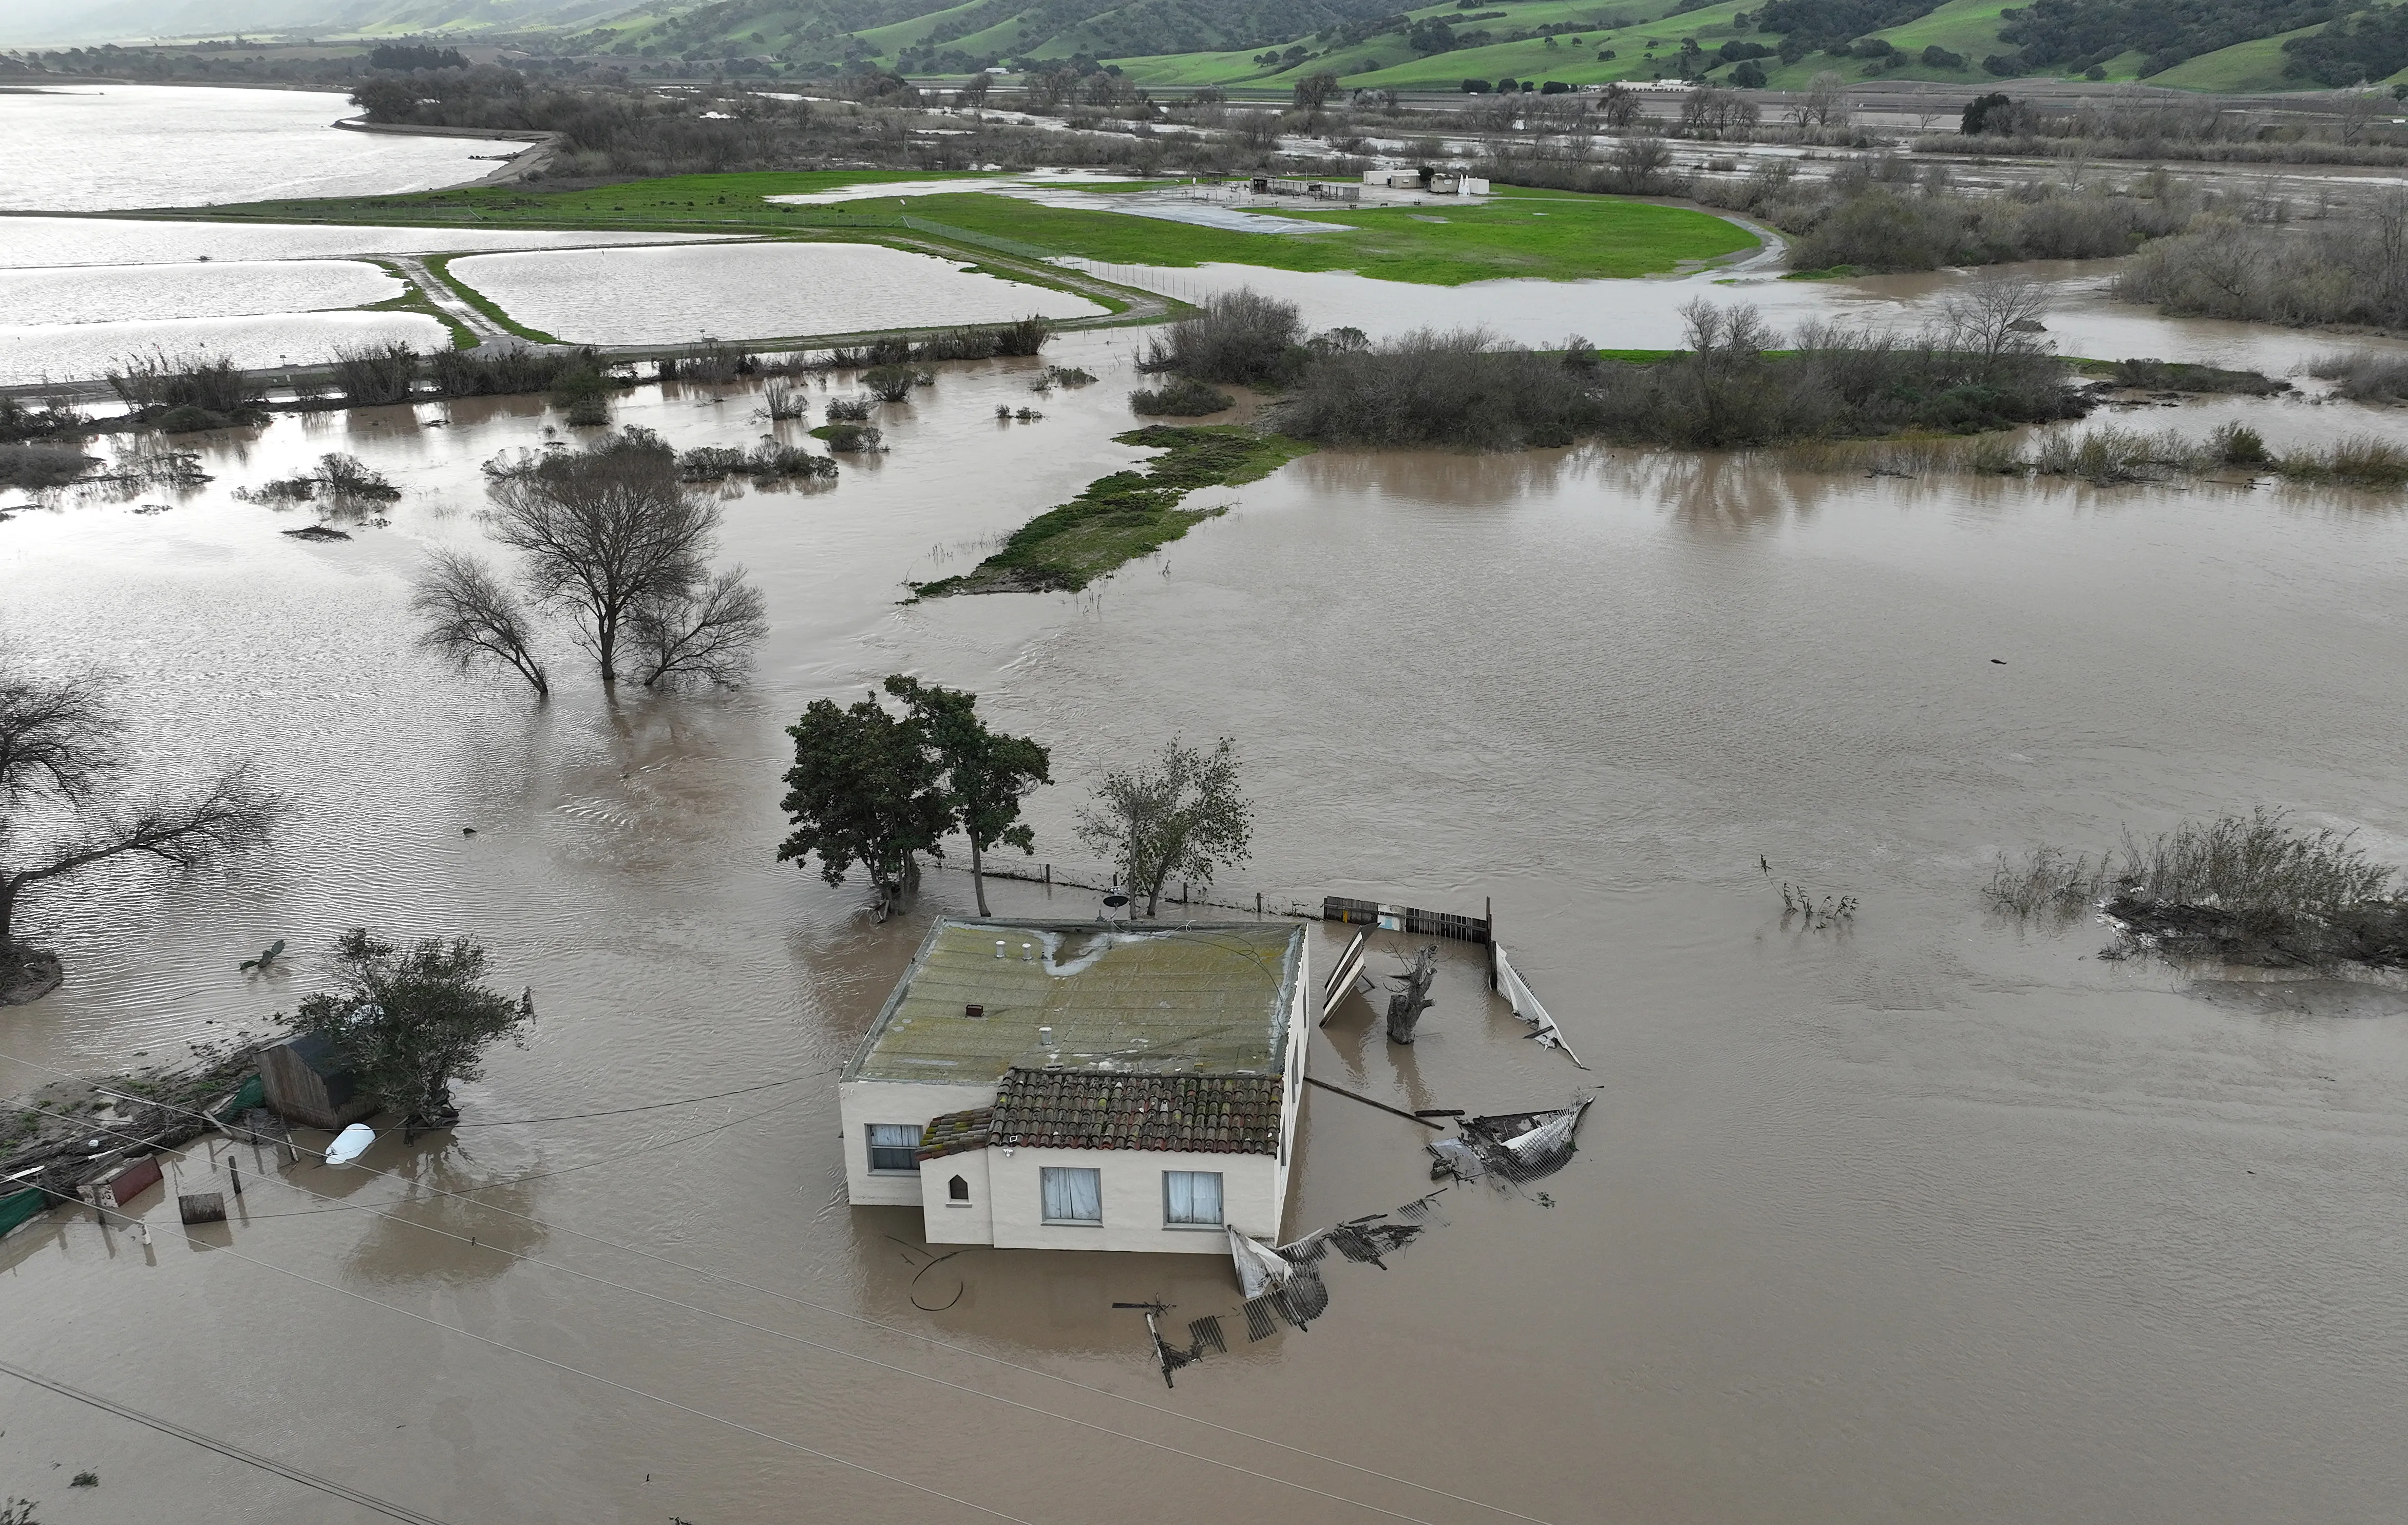
The plain-language definition
A 100-year flood is a flood level (or river flow) that has about a 1% chance of being equaled or exceeded in any given year, based on statistical analysis of past measurements.
That is why you will also hear it called the 1% annual chance flood.
What it does not mean
- Not a promise that floods are spaced 100 years apart.
- Not a statement that you are “safe” for 99 years after one happens.
- Not a guarantee about what will happen next year.
Why two can happen close together
If the odds are 1% each year, then each year is like a new roll of the dice. A rare outcome can happen twice in a row. It is unlikely, but it is entirely possible.
To make that concrete, imagine a town where the river reaches the 100-year flood level with probability 0.01 in any given year.
- The chance of a 100-year flood happening this year is 1%.
- The chance of it happening two years in a row is 0.01 × 0.01 = 0.0001, or 0.01%. That is about 1 in 10,000.
“One in ten thousand” is rare, but if you have thousands of river locations across a country and you watch them for decades, events that rare will show up.
How the odds add up over time
A 1% annual chance does not mean “1% in your lifetime.” Over many years, your chance of seeing at least one 100-year flood increases.
If the probability is 1% per year, then the probability of not seeing it in a year is 99%, or 0.99. Over N years, the probability of never seeing it is approximately 0.99N. So the probability of seeing at least one is:
1 - 0.99^N
- Over 30 years: 1 - 0.9930 ≈ 26%
- Over 50 years: 1 - 0.9950 ≈ 39%
So a “100-year floodplain” can be a very relevant risk over the span of a mortgage.
Where the number comes from
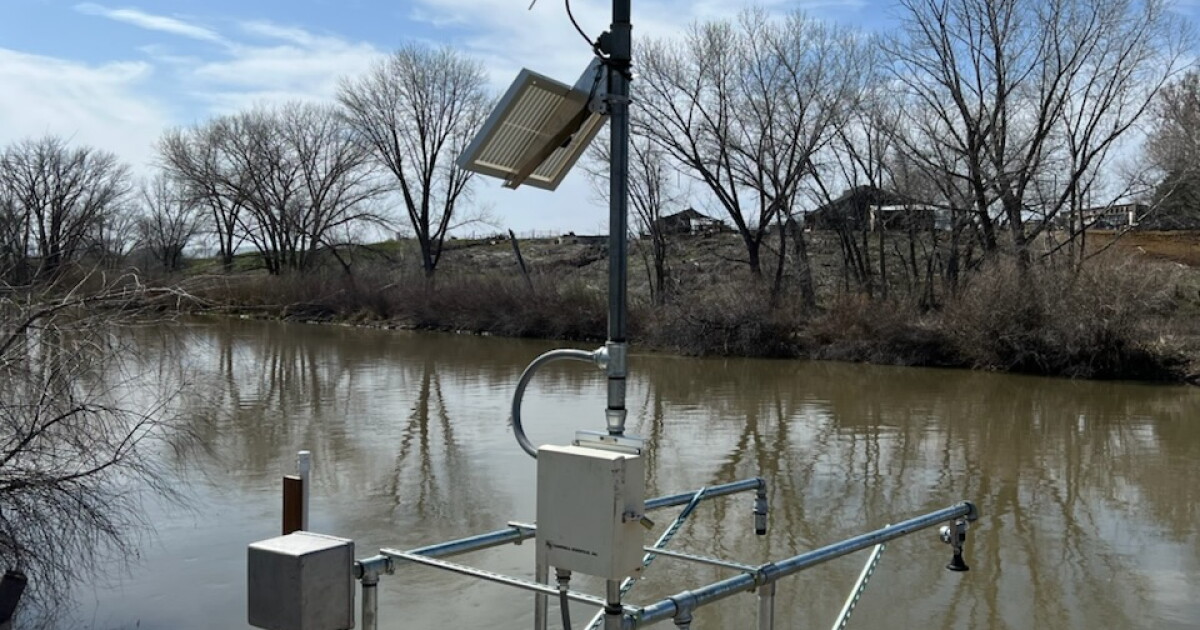
Hydrologists estimate flood probabilities using river gauge records, which measure water level (stage) and often estimate flow (discharge) over time. The core idea is to look at annual peak values: the biggest flood each year.
Depending on the dataset, that annual peak might be the maximum instantaneous discharge (a true peak) or the maximum daily mean discharge. The method is similar, but the numbers can differ.
From those annual peaks, scientists fit a statistical model that links flood size to frequency. One common term you will see is return period:
- Return period (T): how many years correspond to a given probability, on average.
- Annual exceedance probability (AEP): the chance that level is exceeded in a given year.
They are linked by a simple relationship that is widely used in hydrology, assuming the underlying flood risk is roughly stationary over the period you are describing:
AEP = 1 / T
So for a 100-year event, AEP = 1/100 = 0.01, or 1%.
A concrete gauge example
Before we get into numbers, one expectation-setting note: this is not the full agency-grade analysis, but it is a good way to see the logic on a classroom whiteboard.
Suppose a river gauge has been operating for 20 years. Each year, we record the single biggest peak flow for that year (instantaneous or daily mean, depending on the record). We then sort those peaks from largest to smallest.
Here is an example list of annual peak flows in cubic feet per second (cfs) after sorting (largest to smallest):
Rank (m) : Peak flow (cfs)
1  : 24,000
2  : 21,500
3  : 19,800
4  : 18,600
5  : 17,900
6  : 16,300
7  : 15,800
8  : 15,200
9  : 14,400
10 : 13,900
11 : 13,300
12 : 12,900
13 : 12,300
14 : 11,800
15 : 11,100
16 : 10,600
17 : 10,100
18 : 9,700
19 : 9,300
20 : 8,900
Step 1: Rank to probability
A common quick method is a plotting-position formula often called the Weibull plotting position for exceedance probability when the list is ranked from largest to smallest:
p = m / (n + 1)
where:
- m is the rank (1 is the biggest flood)
- n is the number of years of data (here, 20)
For the biggest flood (m = 1):
p = 1 / 21 ≈ 0.0476
That means a flow of about 24,000 cfs corresponds to roughly a 4.8% annual chance, or about a 21-year return period (since T ≈ 1/p ≈ 21).
If you have seen slightly different formulas in other sources, you are not imagining it. There are multiple plotting-position conventions (and some are for non-exceedance rather than exceedance). This is just a standard, quick approximation.
Step 2: Where is the 100-year flood here?
A true 100-year flood corresponds to p = 0.01. With only 20 years of data, you cannot directly observe p = 0.01 from ranks, because even the largest event only gets you to about p ≈ 0.0476. In other words, short records do not contain many extremely rare events.
So in practice, scientists fit a probability distribution to the data and extrapolate to estimate the 1% flood. This is why 100-year flood estimates come with uncertainty bands, and why agencies prefer long, high-quality gauge records when possible.
Making the probability concrete
Assume that after fitting a model, the best estimate for the river is:
- 100-year (1% AEP) flood flow = 26,000 cfs
That number does not say “the next time the river hits 26,000 cfs will be in 100 years.” It says:
- In any given year, the chance the river reaches 26,000 cfs or more is about 1%, based on the model and the gauge record.
What it says about next year
It does say
- Risk is annual. Next year has about a 1% chance of meeting or exceeding the 100-year flood level (under the assumptions used to estimate it).
- Risk can be translated into planning horizons. Over decades, the chance of at least one such event becomes much larger than 1%.
It does not say
- That you are “due” or “not due.” Past floods do not reset the odds.
- That the flood is impossible outside the floodplain line. Flood maps are based on models, topography, and assumptions. Real water can find real paths that do not respect our tidy boundaries.
- That the climate and land use are frozen in time. If watershed conditions change, the true probability can shift.
Flood level, flow, and floodplain
One more quick clarification that helps in the real world: the “100-year” label can be attached to a flow (like cfs at a gauge) or a water-surface elevation (a flood level). Floodplain maps are usually based on modeled water-surface elevations for specific annual-chance events across an area, not just a single gauge number.
That is why two houses in the same town can have very different flood risk, even though both are “near the river.” Elevation and local topography matter a lot.
Why estimates can change
Even if the math is done perfectly, the estimate is only as stable as the world it is trying to describe. A few big drivers can move the goalposts:
- More data. Adding 10 or 20 more years of gauge measurements can change the fitted model, especially if those years include major floods or major droughts.
- Land use changes. Paved surfaces, storm drains, and new development can push rainfall into rivers faster, raising peak flows for the same storm.
- River engineering. Levees, channel straightening, dams, and reservoir operations can raise or lower flood peaks downstream.
- Climate shifts. If heavy rainfall events become more intense or more frequent, the historical record may no longer represent the future. Then the “1% flood” based on the past might underestimate today’s risk.
Maps can change for the same reasons. A revised study, new elevation data, or a different modeling approach can move a floodplain boundary, sometimes by a little and sometimes by a lot.
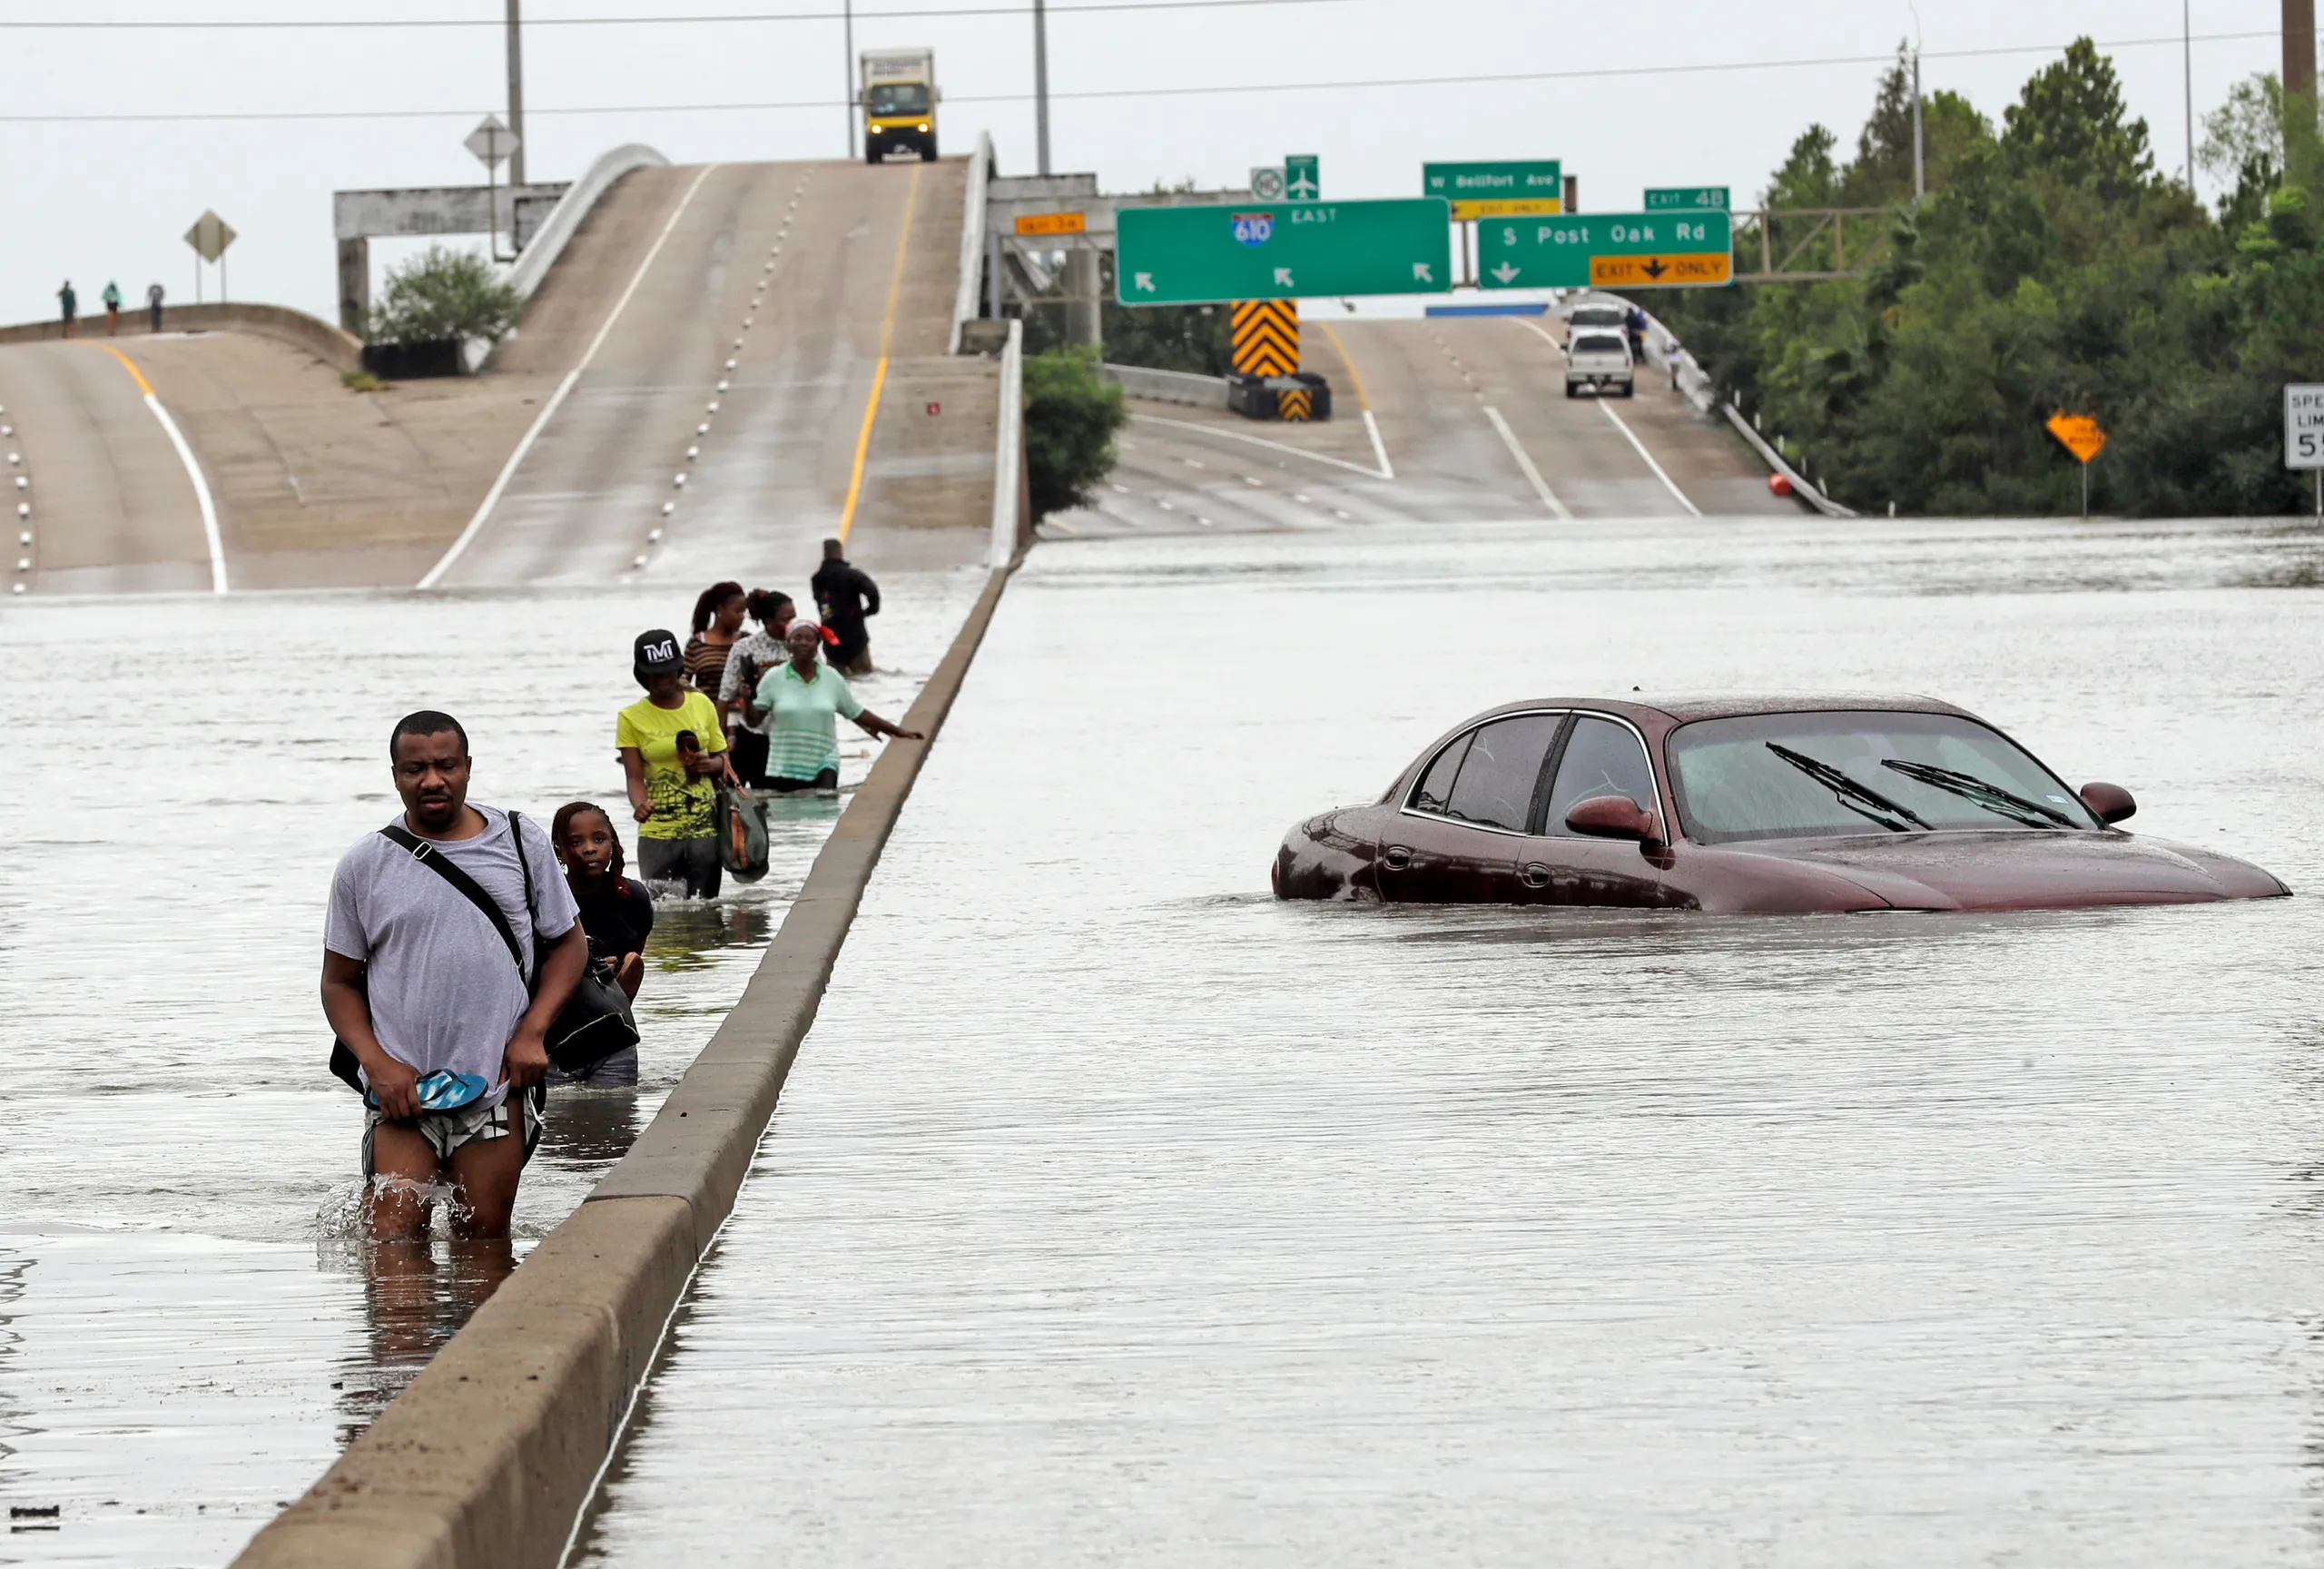
Common misunderstandings
Is a 500-year flood just hype?
No. A 500-year flood is shorthand for a 0.2% annual chance event (1/500 = 0.002). Like the 100-year flood, it is a probability estimate, not a schedule.
If I live in the 100-year floodplain, does that mean my house will flood?
Not necessarily. “Floodplain” lines are usually tied to modeled water-surface elevations and assumptions. Your exact risk depends on elevation, distance to the river, drainage, obstructions, and how floods actually move through your neighborhood.
What if I do not live near a river?
You can still flood. Intense rainfall can overwhelm storm drains and send water into low spots well away from mapped river floodplains. River flooding is not the only pathway.
Why use the word “year” at all?
It is historical convention, and it is convenient shorthand. But the more accurate phrase is the probability one: 1% annual chance flood.
Quick takeaway
If you remember just one thing, make it this: a 100-year flood is a probability, not a prophecy. It means about a 1% chance each year of reaching or exceeding a particular flood level, estimated from gauge records and models. That is why two “100-year floods” can happen a few years apart, and why the label does not give you a countdown clock for next year.
FAQ
What is the chance during a 30-year mortgage?
Approximately 1 - 0.9930 ≈ 26%, assuming the 1% annual chance stays constant over that period.
Does it mean it will not happen again for 100 years?
No. The probability resets each year. A 100-year flood could happen this year and again next year.
How do scientists estimate it with a short record?
They use statistical methods to fit a distribution to observed annual peaks, often supplemented with regional information and hydrologic modeling. Short records increase uncertainty, especially for rare events like the 1% flood.