I used to tell my physics students that a model is basically a “what-if machine.” You feed it the rules of nature, give it a starting snapshot of the world, and then ask, “If we keep pushing in this direction, what tends to happen?” Climate models are that idea scaled up to the entire planet, with oceans, atmosphere, ice, land, and living ecosystems all talking to each other.
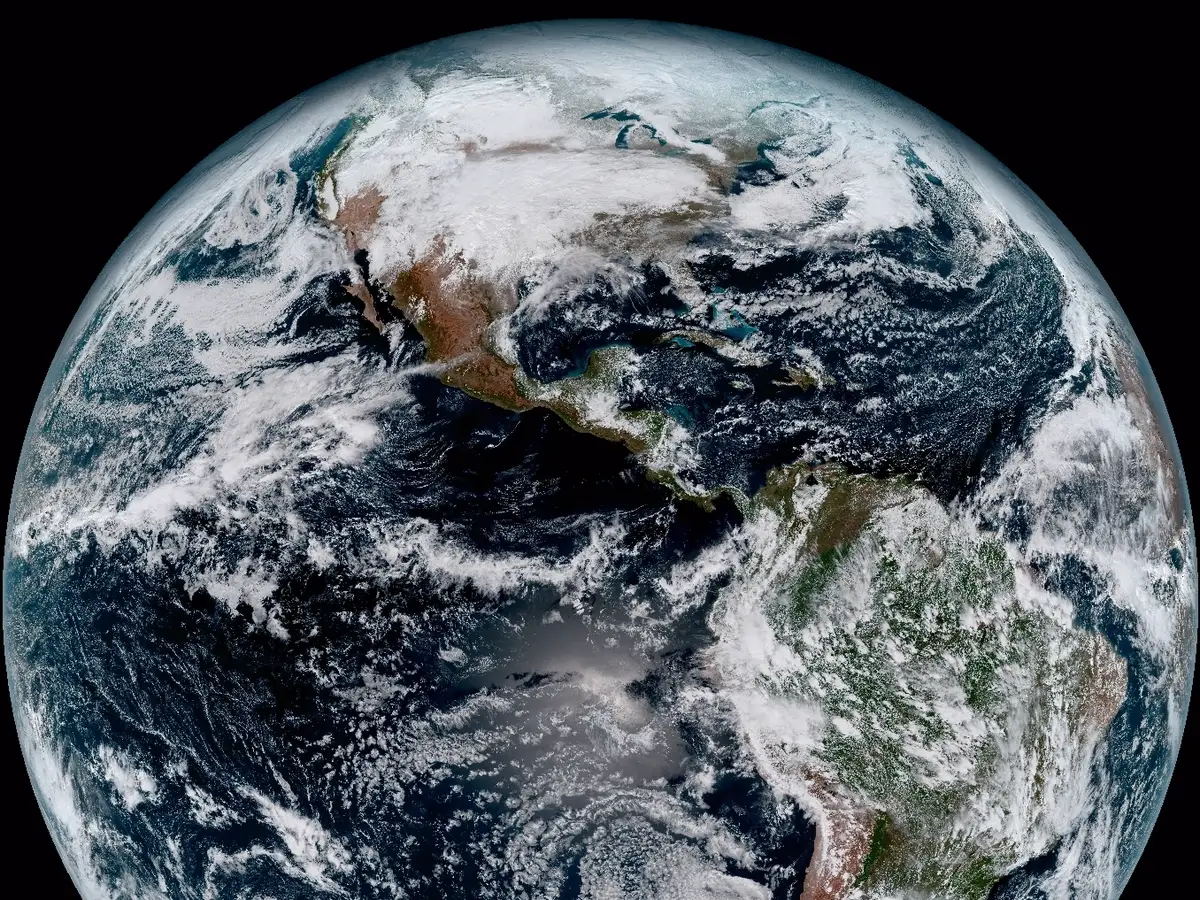
Importantly, climate models are not crystal balls for next Tuesday’s weather. Their superpower is statistics over long stretches of time: averages, ranges, patterns, and how those patterns shift when greenhouse gases rise or fall.
Climate models in one sentence
A climate model is a numerical Earth system that simulates how energy, water, air, and carbon move through the planet under different greenhouse-gas pathways, using the laws of physics on a global grid.
If that sentence felt like a mouthful, do not worry. We can take it apart piece by piece.
Earth, chopped into grid boxes
To simulate a planet, you need a way to “store” its state. Climate models do this by dividing Earth into 3D grid boxes.
- In the atmosphere, grid boxes stack upward like layers of a cake, tracking temperature, pressure, humidity, winds, and more.
- In the ocean, grid boxes stack downward, tracking currents, temperature, salinity, and mixing.
- On land, models track soil moisture, snow, vegetation, and energy exchange with the air.
- For sea ice, models track thickness, extent, drift, and melt and freeze rates.
Each grid box represents an area that might be tens to hundreds of kilometers wide (plus vertical layers). Historically, many global climate models ran closer to the ~100 to 250 km range; newer generations often push toward ~25 to 100 km for some experiments, depending on the model and computing budget. That means a grid box is not “a city.” It is closer to “a chunk of atmosphere big enough to fit a few cities and the countryside between them.”
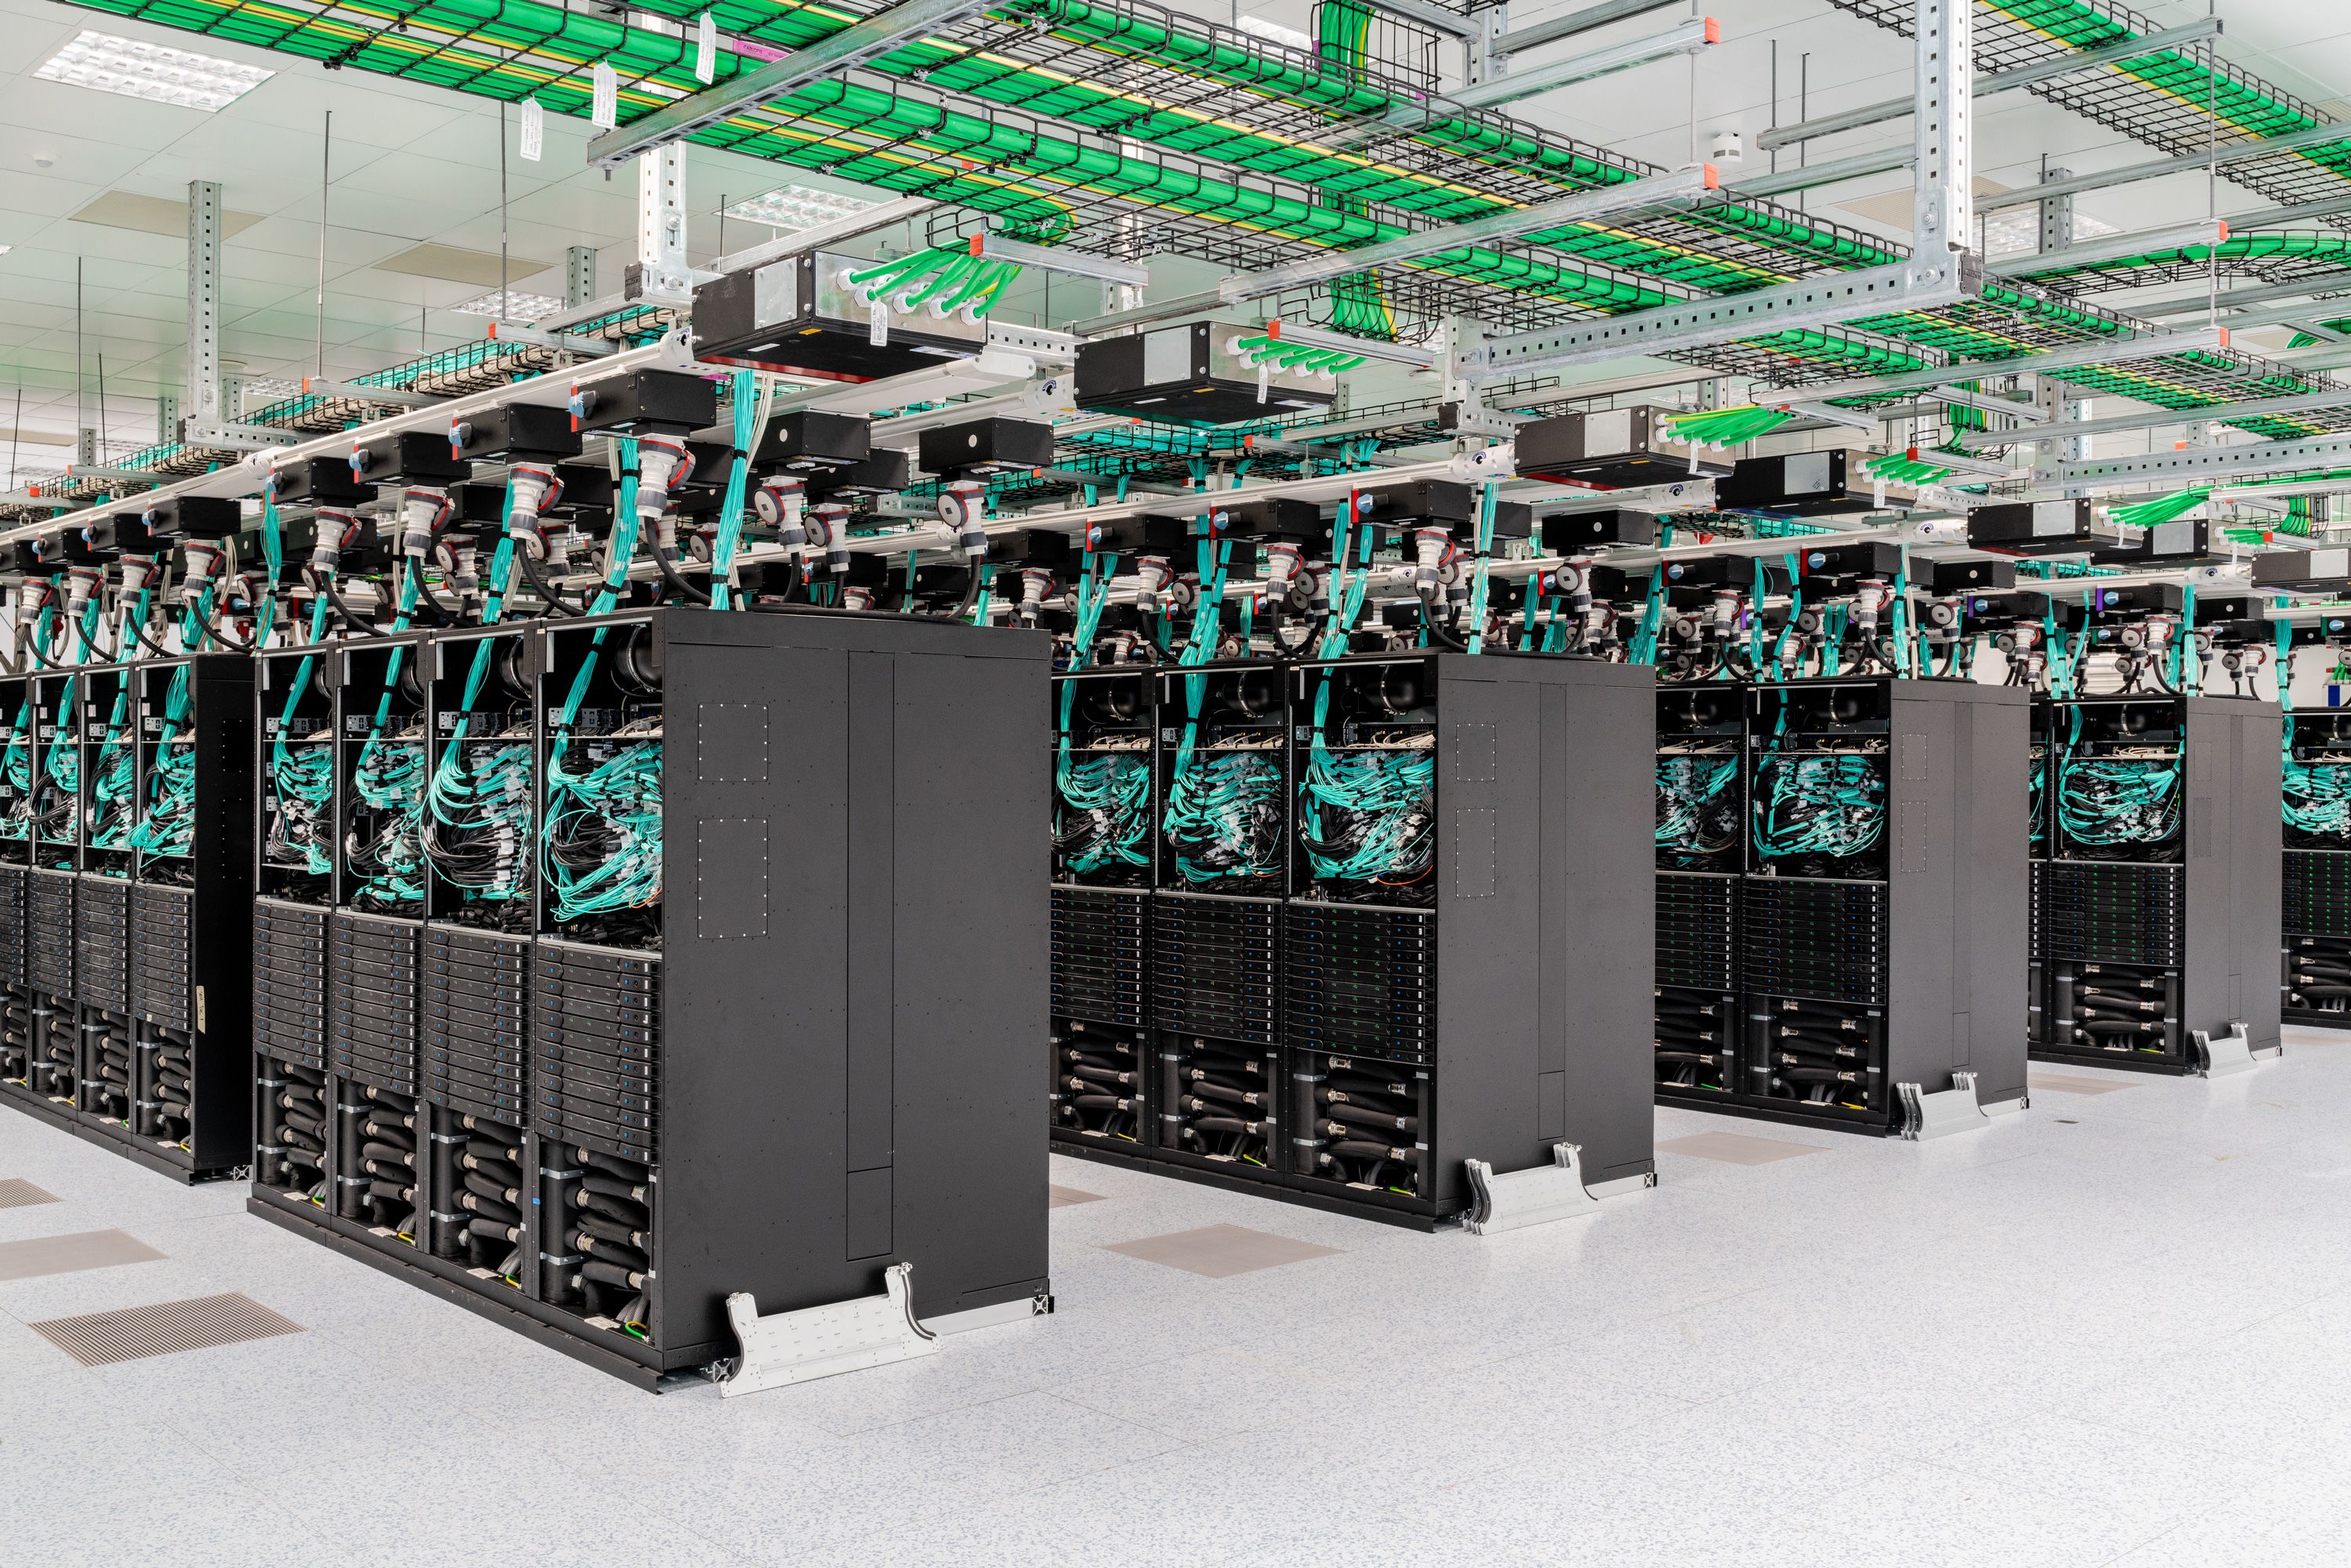
The model stores numbers for each grid box, then updates those numbers forward in time, step by step, using equations.
What equations are inside a climate model?
At the core, climate models apply conservation laws. The same ideas you meet in basic physics show up everywhere:
- Conservation of energy: sunlight in, infrared heat out, plus energy moved around by winds and ocean currents.
- Conservation of mass: air and water do not vanish, they move and change phase (evaporation, condensation, freezing).
- Conservation of momentum: winds and currents accelerate and slow due to pressure differences, Earth’s rotation (the Coriolis effect), and friction.
On top of that, most modern models include additional “modules,” such as:
- Radiation (how gases, clouds, and aerosols absorb and emit energy).
- Cloud microphysics (how droplets and ice crystals form and evolve).
- Atmospheric chemistry (ozone, methane, and reactive pollutants).
- Carbon cycle (how carbon moves between air, ocean, soils, and ecosystems).
- Dynamic vegetation (how plant growth and stress change land-atmosphere exchanges).
This is why you often hear the phrase Earth system model. Many models do not just simulate “climate” as temperature and rainfall. They simulate a coupled planet.
Forcing and feedback
Two words you will hear constantly around climate modeling are forcing and feedback.
- Forcing is a push on the climate system, like increasing CO2 (more heat trapped), a big volcanic eruption (temporary cooling from reflective aerosols), or changes in the Sun’s output.
- Feedback is the system’s response that can amplify or dampen the original push. A warmer atmosphere can hold more water vapor (a greenhouse gas), which tends to amplify warming. Melting ice reduces Earth’s reflectivity, so more sunlight is absorbed, which also tends to amplify warming.
A lot of climate-model work is about getting the balance of these feedbacks right, especially cloud-related ones.
Why not use tiny grid boxes?
Because computing is finite and the planet is huge.
The scaling is brutal. If you halve the horizontal grid spacing, you get about 4 times as many grid cells on a global map (2D). In a full 3D model you often also add vertical detail, and you usually need smaller time steps to keep the numerics stable, which adds more cost. Put it together and total computing can easily jump by something like 8 to 16 times (or more), depending on the exact choices.
And there is another catch: some processes are small by nature. Even with very high resolution, you will still have turbulence and cloud droplets and soil pores that are smaller than the grid. So modelers use a different tool: parameterization.
Also, many major simulations can take weeks to months of wall-clock time on supercomputers once you factor in high resolution, long time spans, and large ensembles.
Parameterization
Some processes happen on scales smaller than a grid box, or faster than the time step, but they still affect the big picture. A climate model cannot track every cloud puff and swirling eddy, so it uses parameterizations: simplified, physics-guided formulas that estimate the average effect of those sub-grid processes.
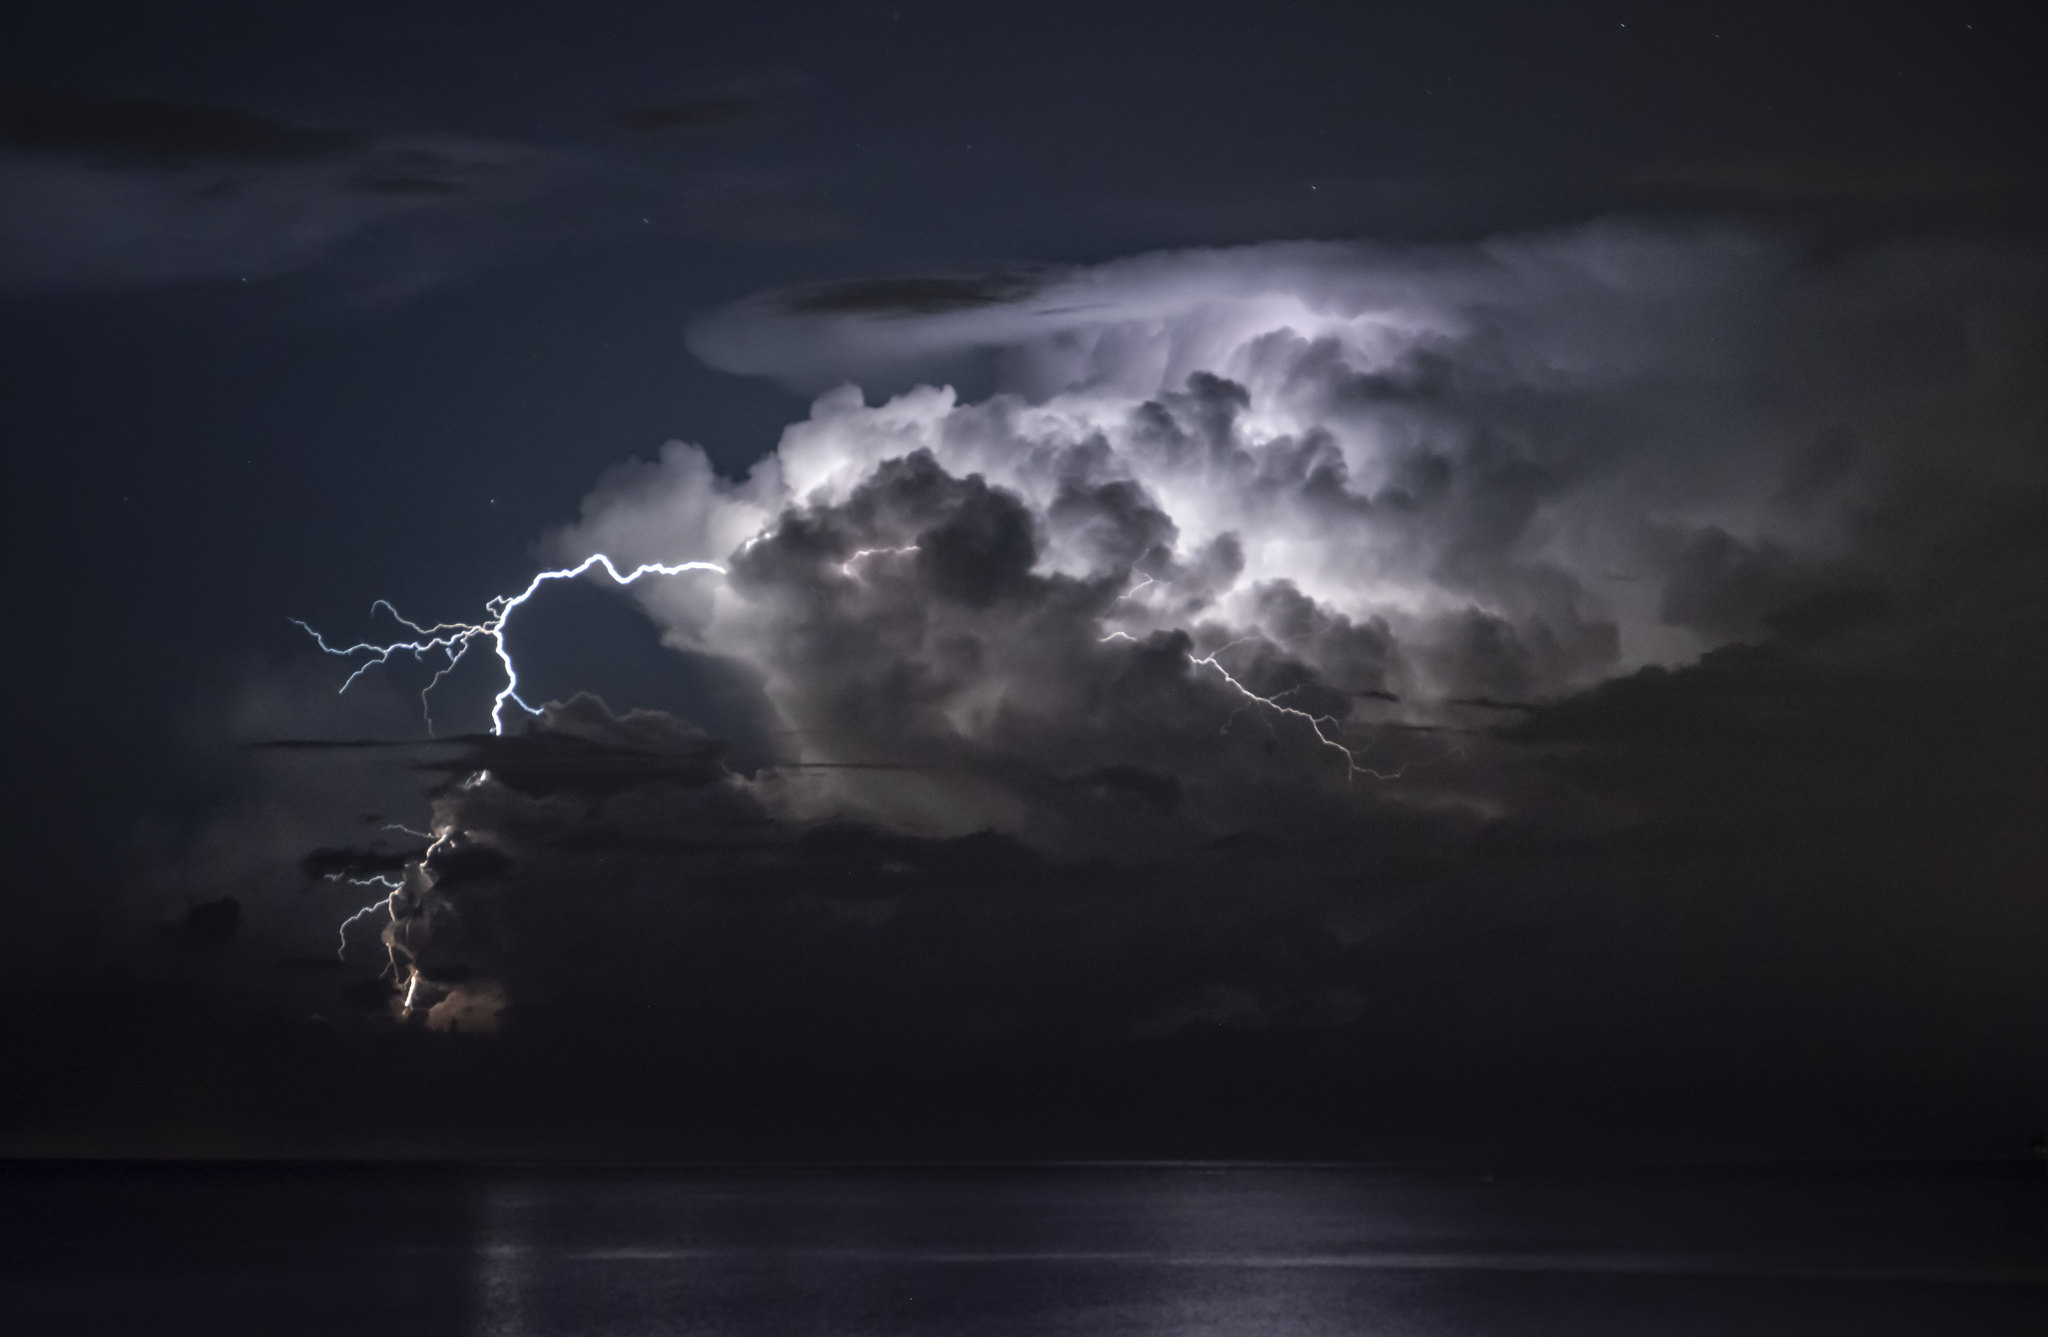
A concrete example: a convection parameterization might estimate how thousands of unresolved thunderstorms inside one grid box, taken together, change the grid box’s average heating, moistening, cloud cover, and rainfall rate over the next time step.
Commonly parameterized processes include:
- Cloud formation and convection (the rising plumes that power thunderstorms).
- Turbulence in the boundary layer near the surface.
- Small-scale ocean mixing and eddies below grid scale.
- How raindrops, snow, and ice crystals grow and fall.
Parameterizations are where a lot of the hard work lives. They are built from theory, lab measurements, field campaigns, and higher-resolution simulations that resolve smaller details over limited regions. Scientists constantly test and refine them because small assumptions about clouds, for example, can noticeably change how sensitive the model is to greenhouse gases.

What is a pathway?
When models look decades ahead, they need a storyline for what humans do next. Will emissions keep rising? Plateau? Fall quickly? Those plausible futures are called greenhouse-gas pathways or scenarios.
A scenario is not the model “guessing policy.” It is the user giving the model a set of inputs, such as:
- Future carbon dioxide and methane concentrations, or emissions that the model translates into concentrations in emissions-driven Earth system model runs.
- Air pollution trends that affect aerosols and cloud brightness.
- Land-use changes like deforestation or reforestation.
Then the model answers a physics question: Given these atmospheric and land-surface changes, how does the Earth system respond?
Forecasts vs projections
This is the confusion I bump into most often, so let’s make it crisp.
Weather forecasting is an initial-condition problem
To forecast weather, you need a very accurate snapshot of today’s atmosphere and ocean. Small errors can grow quickly, which is why forecasts get fuzzier as you go out in time.
Climate projection is more of a boundary-condition problem
For climate, the exact wiggles of day-to-day weather matter less than the big constraints, like greenhouse gas levels, the Sun’s energy, and Earth’s reflective properties (ice, clouds, aerosols, land cover).
In practice, models still simulate weather. They just do it in a way that is used to compute climate statistics: trends, averages, extreme-event frequency, and shifts in patterns.
What a projection estimates
A multi-decadal projection is meant to estimate how the probability distribution of climate conditions changes over many years, not the exact sequence of events.
Think of it like loading a pair of dice.
- Weather is each individual roll.
- Climate change is slowly changing how the dice are weighted, so certain outcomes become more or less likely.
That is why climate papers talk about things like:
- How much warmer the average year becomes by mid-century.
- How heat extremes shift from rare to common.
- How precipitation intensity changes even if total rainfall is similar.
- How drought risk changes as evaporation increases in a warmer world.
- How sea level rises from ocean expansion and land ice melt.
When you see a projection such as “warming of X degrees by 2100 under scenario Y,” it is shorthand for an ensemble of simulations that estimate a range, with uncertainty coming from both the model and the future pathway.
Why run many simulations?
Because the climate system has natural variability, also called internal variability. Even with the same greenhouse gas pathway, internal wiggles like El Niño and La Niña can shuffle heat and rainfall patterns around from decade to decade.
So scientists run ensembles, meaning:
- Multiple runs of the same model with tiny differences in initial conditions.
- Runs from many different modeling groups around the world.
If many models, with different designs, still agree on the broad direction and magnitude of changes, confidence rises. Where they disagree, that is a clue about where uncertainties are still stubborn, often involving clouds, regional rainfall, or ocean circulation details.
How models are checked
Model evaluation is a constant loop of “simulate, compare, improve.” Scientists test whether models can reproduce:
- Seasonal cycles (monsoons, winter storms, summer heat).
- Large-scale patterns (jet streams, trade winds, ocean gyres).
- Past climate trends when driven with historical greenhouse gases, aerosols, volcanoes, and solar changes.
- Extremes statistics (heat wave frequency, heavy rain intensity, drought metrics) within known limits.
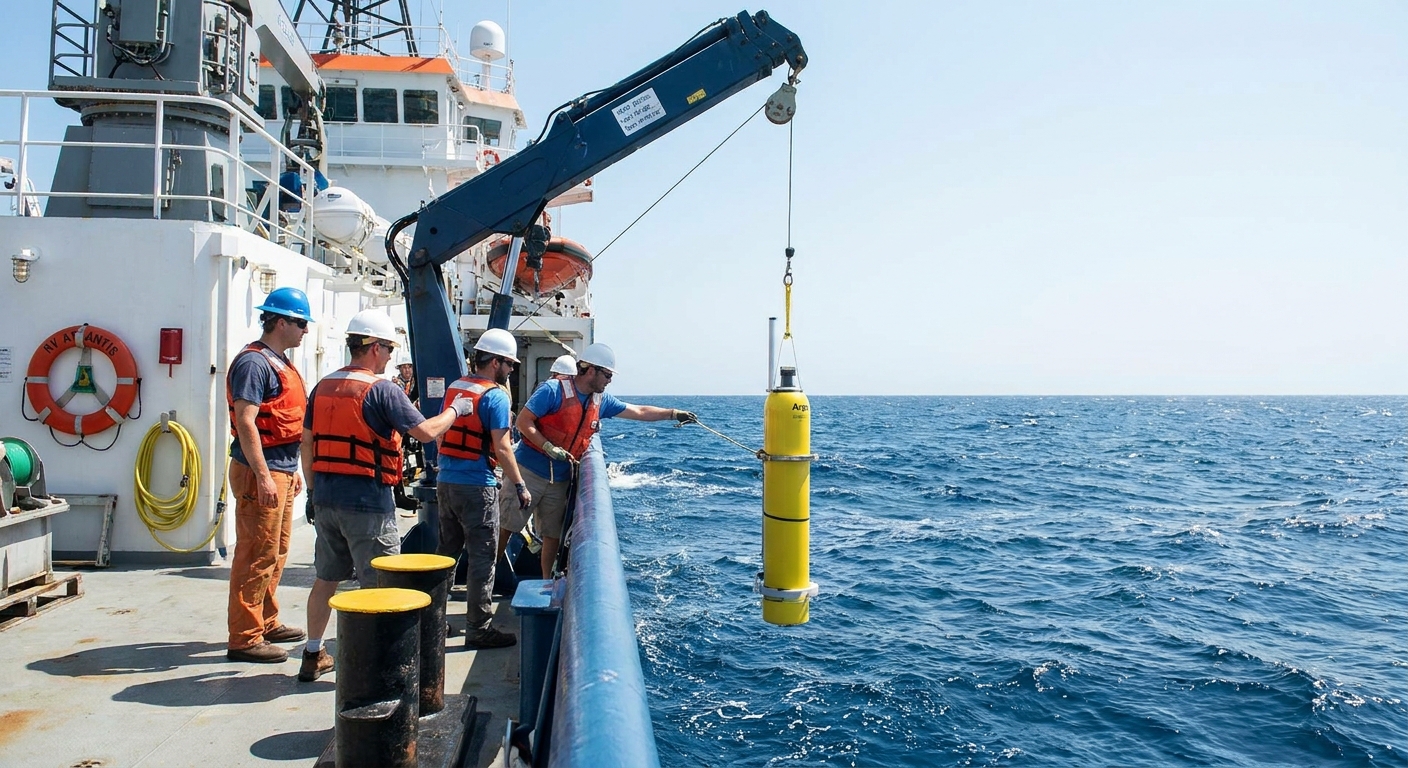
A key point: models are not tuned to match every local detail everywhere. They are tuned and evaluated across a huge collection of observations and physical constraints. The goal is not perfection in one place. It is reliable physics across the whole Earth system.
What models can and cannot do
Models are strong at
- Global temperature trends under different greenhouse-gas pathways.
- Sea level rise components like ocean thermal expansion and broad-scale changes, while ice-sheet contributions remain a larger uncertainty and are often handled with separate or loosely coupled ice-sheet models.
- Big-picture shifts in heat extremes.
- Changes in the water cycle, including heavier downpours in many regions.
Models struggle more locally
- Rainfall and storms at city or neighborhood scale.
- Exactly where a specific storm track will go decades from now.
- Cloud feedback details that depend on tiny scales.
This is why you will often see regional studies use additional tools, such as higher-resolution regional models or statistical downscaling, to translate global projections into more local risk estimates.
Event attribution
Sometimes you will hear about studies asking whether a specific heat wave or flood was “made more likely” by climate change. That field is called event attribution, and it often uses climate models too, but with a different setup.
Instead of projecting decades ahead, attribution studies compare model worlds with today’s greenhouse gas levels to model worlds without the human-caused increase, then estimate how the odds or intensity of that kind of event changes.
That is a powerful approach, but it is not the main job of the long projections we have been talking about here.
The takeaway
Climate models are big, coupled “what-if machines” built from physics. They divide Earth into grid boxes, solve conservation laws through time, and use parameterizations to represent important small-scale processes like clouds and turbulence. When they run multi-decadal projections under different greenhouse-gas pathways, they are estimating how the odds and patterns of climate conditions shift, not predicting the exact weather on a specific date.
If you want a mental image to keep: a climate model is less like a fortune teller and more like a flight simulator for the planet. You can learn a lot about how the system responds to different controls, even though you cannot predict every bump of turbulence along the way.
FAQ
Are climate models the same as weather models?
They share a lot of the same physics, especially the equations for atmospheric motion. The difference is the goal: weather models focus on the next days, climate models focus on statistics over decades and how those statistics change with greenhouse gases and other forcing.
Why do different models give different answers?
Models make different design choices: grid resolution, how clouds are parameterized, how aerosols are treated, and how the ocean mixes heat. They also have different ways of representing complex feedbacks. Ensembles help reveal what is robust versus uncertain.
If models are uncertain, why trust them?
Uncertainty is not the same as ignorance. Models are constrained by well-tested physics and are evaluated against observations and past climate behavior. They reliably capture major features like global warming under increased greenhouse gases, even while some regional details remain harder.
What does “downscaling” mean?
Downscaling is a way to translate global model information to finer regional scales. It can be done with higher-resolution regional climate models or with statistical methods that use historical relationships between large-scale patterns and local weather.