Curiosity, with all its quills showing.
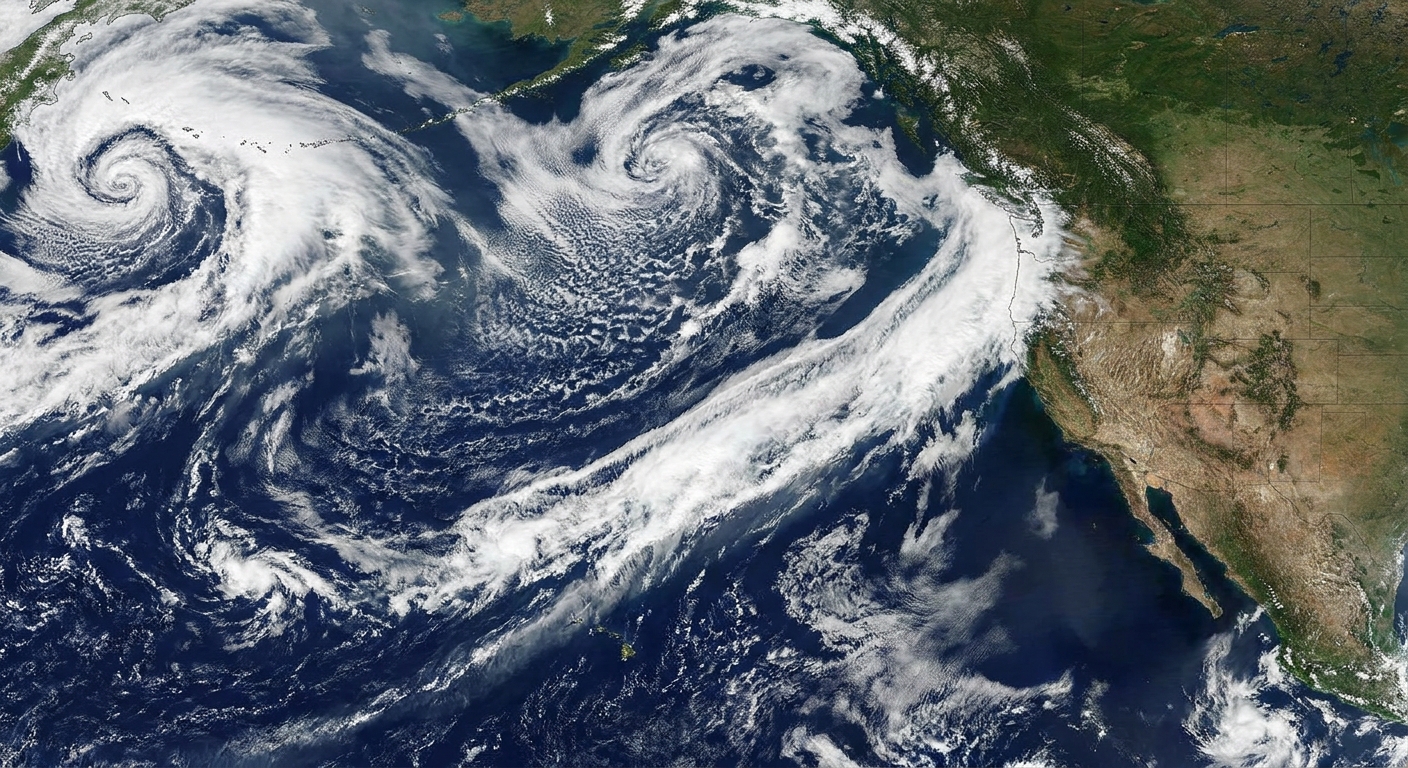
If you have ever heard a forecast call an incoming atmospheric river a “Category 3” or “Category 5,” that number is not a vibe check. It comes from a research-based scale designed to communicate two things at once: how intense the moisture transport is and how long it is expected to persist.
The most commonly referenced system is the Atmospheric River (AR) Scale developed by the Center for Western Weather and Water Extremes (CW3E). It ranks events from AR Category 1 to AR Category 5 with a simple premise: strength plus staying power helps convey typical impact potential. It is still a meteorological scale with impact language attached, not a guarantee of what your street will do.

What the 1 to 5 rating measures
CW3E’s scale is built around a metric called integrated vapor transport, usually shortened to IVT.
IVT in plain language
IVT describes how much water vapor is moving through the atmosphere in a given place and time. It combines:
- Moisture amount in the air
- Wind speed and direction carrying that moisture
Think of it like a moving conveyor belt of water vapor. Higher IVT means a stronger conveyor belt.
Duration matters as much as intensity
An atmospheric river can be strong but brief, or moderate but persistent. CW3E’s scale is built to reflect both realities by using:
- Peak IVT during the event (at a given location)
- How long IVT stays above the AR threshold (the event’s duration)
This is why the scale can capture an important forecasting truth: a long-lasting, high-IVT event is more likely to produce major flooding and infrastructure impacts than a short-lived burst, even if both have an impressive peak at some point.
How CW3E assigns the AR Category
The CW3E AR Scale defines categories using peak IVT bins, then applies a duration adjustment based on how long the event persists above an AR threshold at that same location. (This is also why the category can vary along the corridor and shift hour to hour.)
Key thresholds (with a little humility)
A commonly used lower bound for “AR conditions” is IVT of about 250 kg m−1 s−1. From there, CW3E materials commonly summarize category bins by peak IVT roughly like this:
- Cat 1: about 250 to 500 kg m−1 s−1
- Cat 2: about 500 to 750 kg m−1 s−1
- Cat 3: about 750 to 1000 kg m−1 s−1
- Cat 4: about 1000 to 1250 kg m−1 s−1
- Cat 5: about 1250+ kg m−1 s−1
Then duration steps in. In CW3E’s guidance, the time spent above the AR threshold (often expressed in hours) can adjust the base category up or down by about one category, and the final label stays capped within AR 1 through AR 5. Translation: persistence can turn “that was intense” into “this is a problem,” or take the edge off a brief hit.
One more detail that matters in real forecasts: category can vary by location and time within the same storm. The “same” atmospheric river might be a Cat 2 at one point along the coast and a Cat 4 where the core of the moisture plume makes landfall.
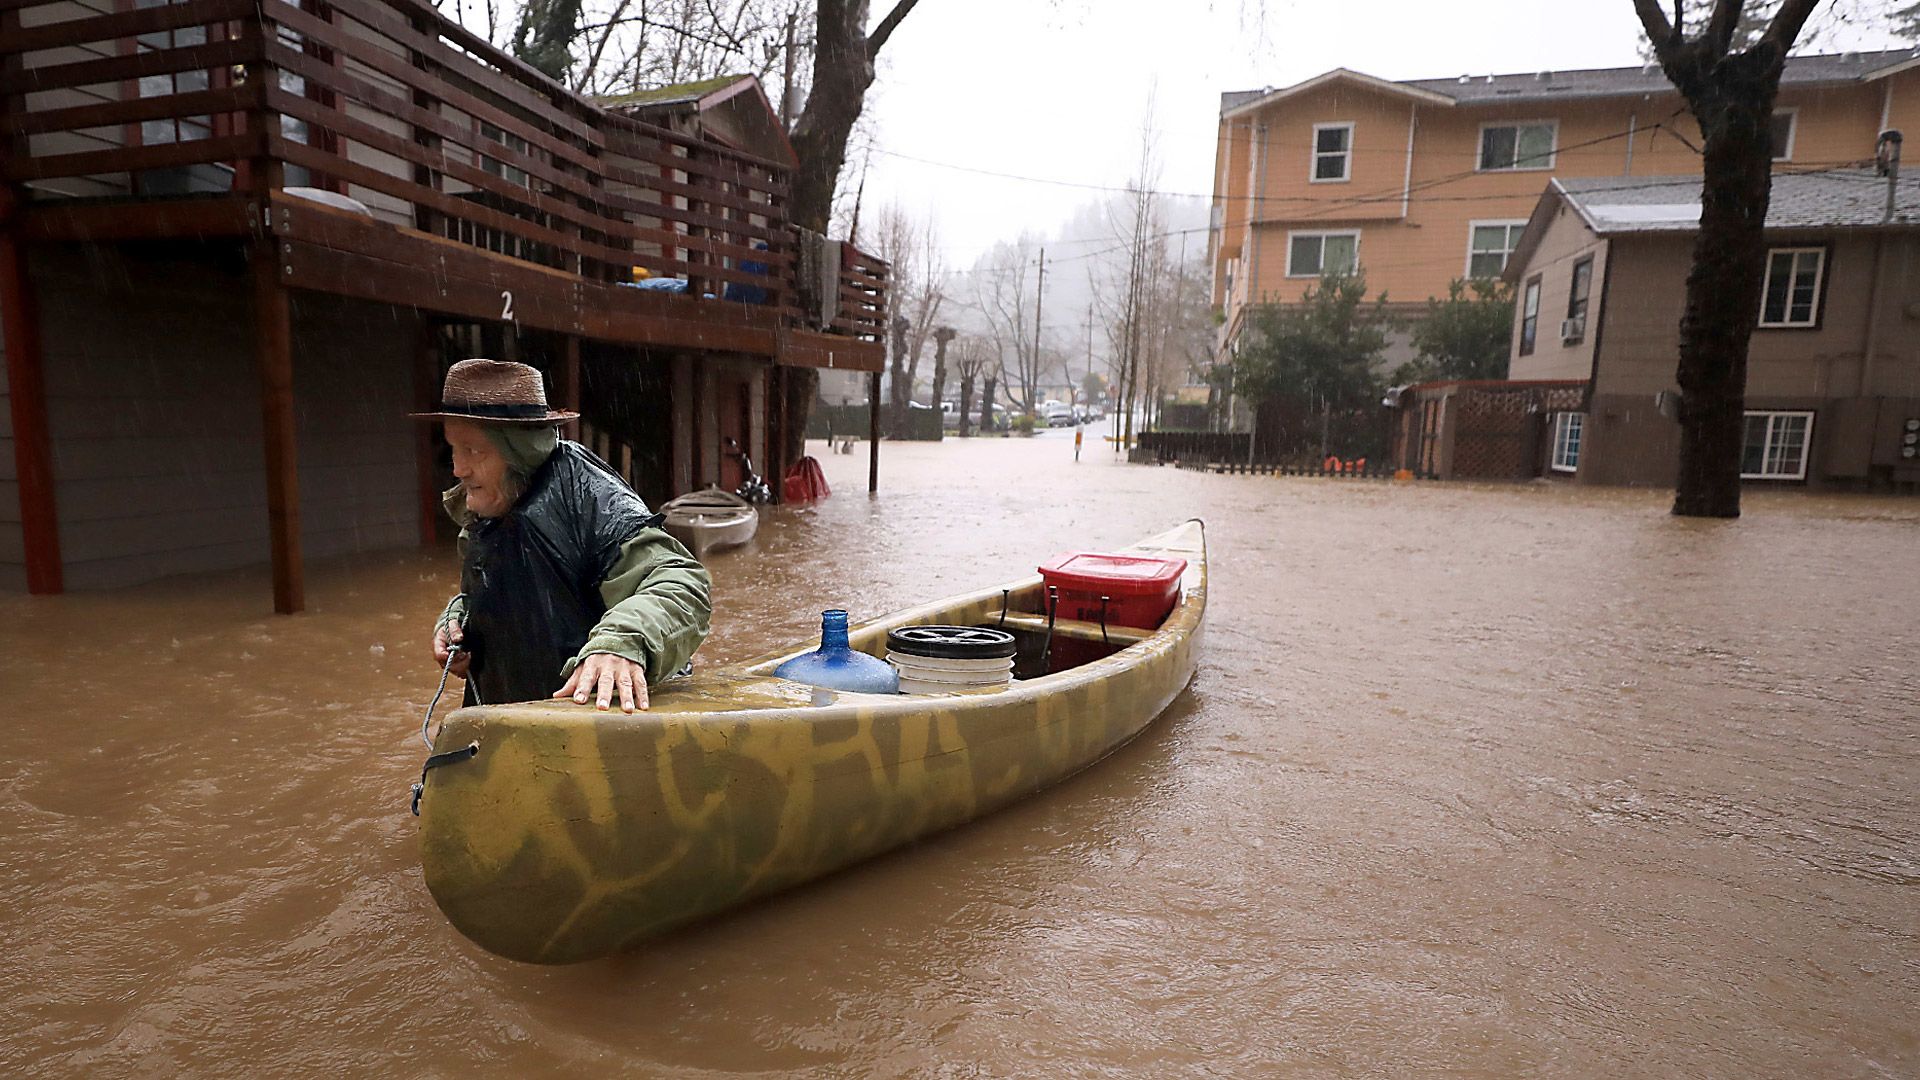
What each AR category means
CW3E pairs each category with impact language that acknowledges a key atmospheric river fact: the same type of storm can be beneficial or hazardous depending on context. Soil moisture, snow level, burn scars, reservoir storage, terrain, and local infrastructure all shape outcomes.
AR Category 1: Mostly beneficial
Typical idea: A modest atmospheric river that can deliver helpful precipitation, especially to reservoirs and mountain snowpack, with limited disruption.
- Often beneficial for water supply
- Localized minor issues possible, like small creek rises or slick roads
AR Category 2: Mostly beneficial, some hazards
Typical idea: A stronger or longer event where benefits are still common, but hazards start to show up, especially in vulnerable locations.
- Good precipitation totals for snowpack and reservoirs
- More frequent minor flooding in poor drainage areas
- Higher landslide risk on steep slopes if soils are already wet
AR Category 3: Balance of benefit and hazard
Typical idea: This is where the scale starts to signal real potential for disruption. Whether the outcome skews helpful or harmful can depend strongly on what came before.
- Can be very beneficial during drought, especially if temperatures keep snow levels lower
- Can be hazardous if it is warm, long-lasting, or arrives on saturated ground
- River rises and roadway flooding become more likely
AR Category 4: Mostly hazardous
Typical idea: Strong IVT or long duration. Major impacts become more likely, especially in steep terrain and along rivers.
- Widespread heavy precipitation
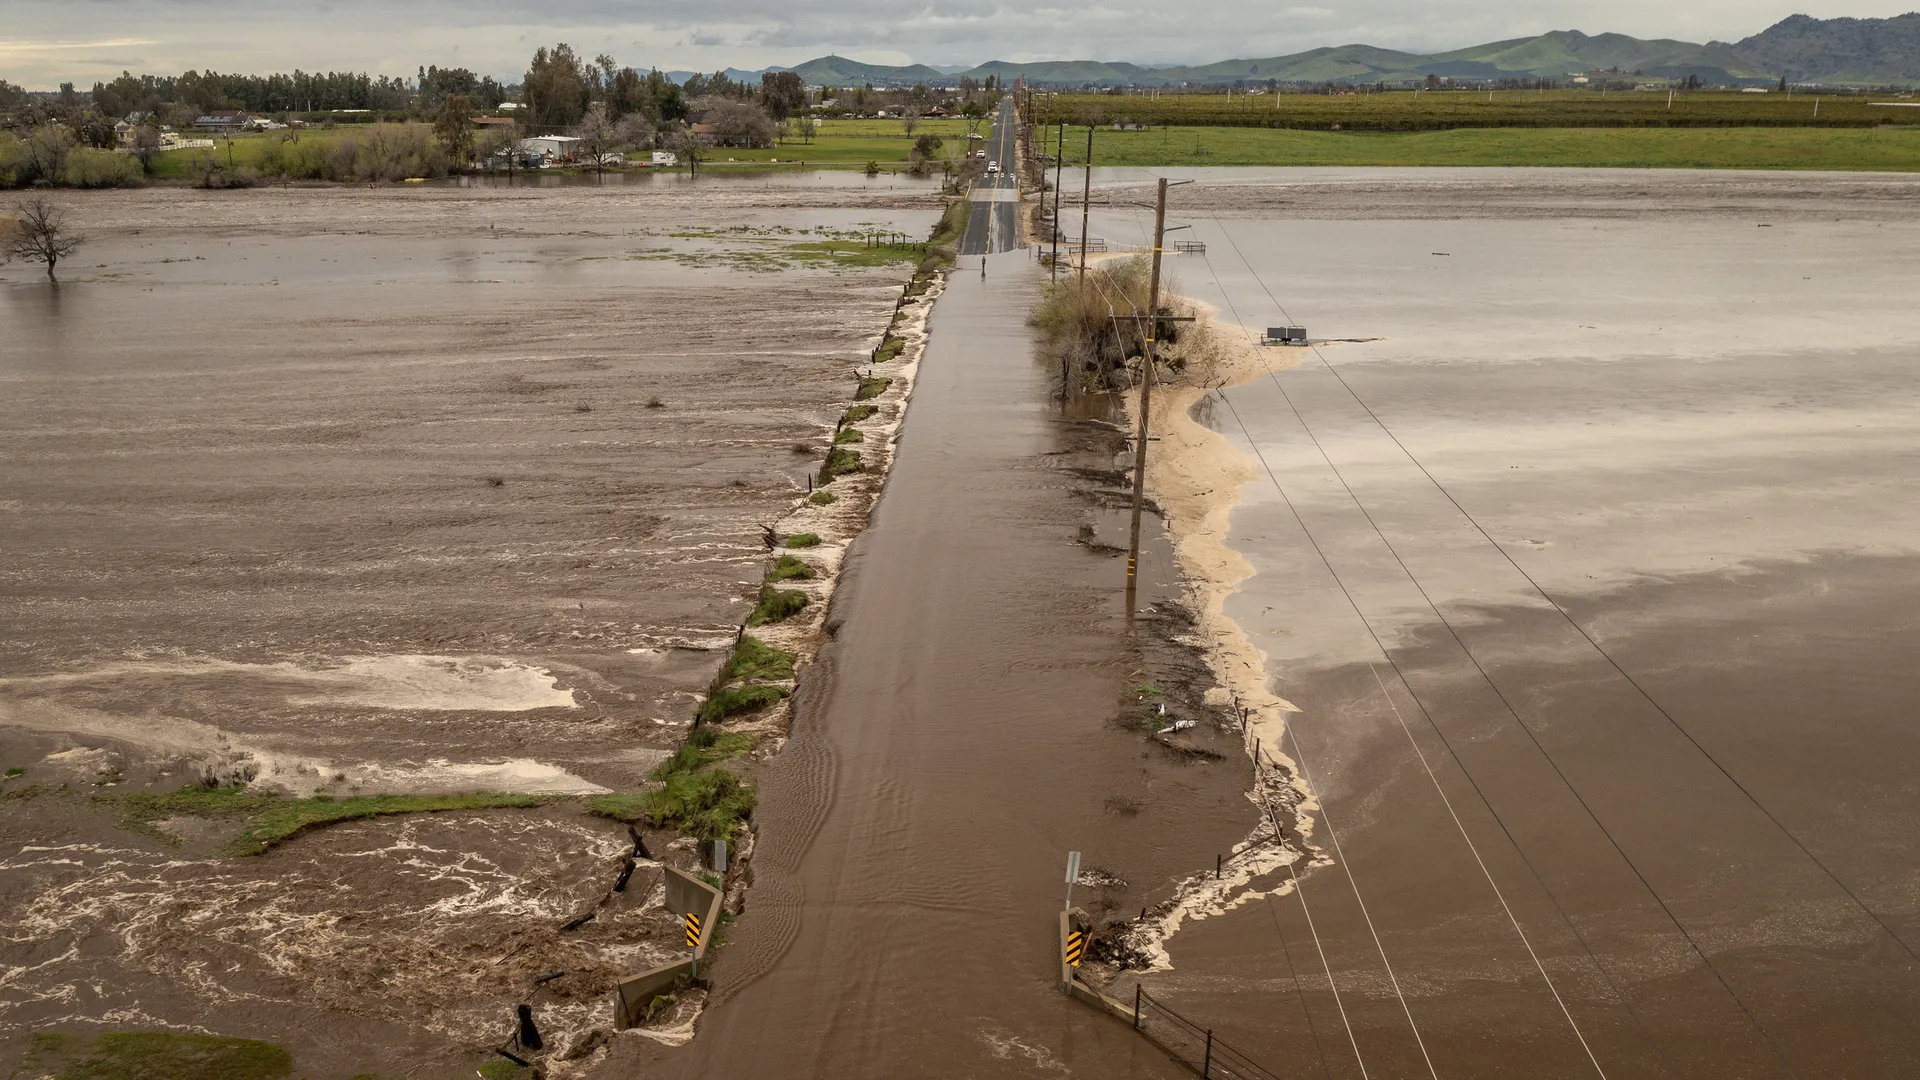
- Flooding risk increases sharply, including rivers
- Landslides and debris flows more likely, particularly near burn scars
- High winds can compound impacts, such as downed trees and power lines
AR Category 5: Primarily hazardous
Typical idea: The strongest and or longest events, where the scale is waving a bright flag for high-end impacts.
- Widespread, potentially extreme precipitation
- Significant flooding, including major rivers
- High likelihood of landslides in susceptible areas
- Serious infrastructure impacts become plausible, from road washouts to prolonged outages
Why “beneficial” and “hazardous” can both be true
It is tempting to treat the AR scale like the hurricane scale, where higher numbers always mean “worse.” But atmospheric rivers are different. They are a water delivery mechanism, and along the U.S. West Coast they can account for a sizable share of annual precipitation in some areas.
So what changes an event from welcome to dangerous?
- Antecedent soil moisture: If the ground is already saturated, rainfall becomes runoff faster.
- Snow level: A warm storm that rains on snow can rapidly increase runoff.
- Storm sequence: Several moderate ARs in a row can produce major flooding even if no single event is a Cat 5.
- Terrain and land cover: Steep slopes, recent wildfire burn scars, and certain soil types raise landslide risk.
- Where the plume stalls: Orographic lift can wring out tremendous precipitation when the flow is aimed directly at coastal ranges or the Sierra Nevada and persists.
In other words, Category describes the meteorological punch. The impacts depend on where that punch lands.
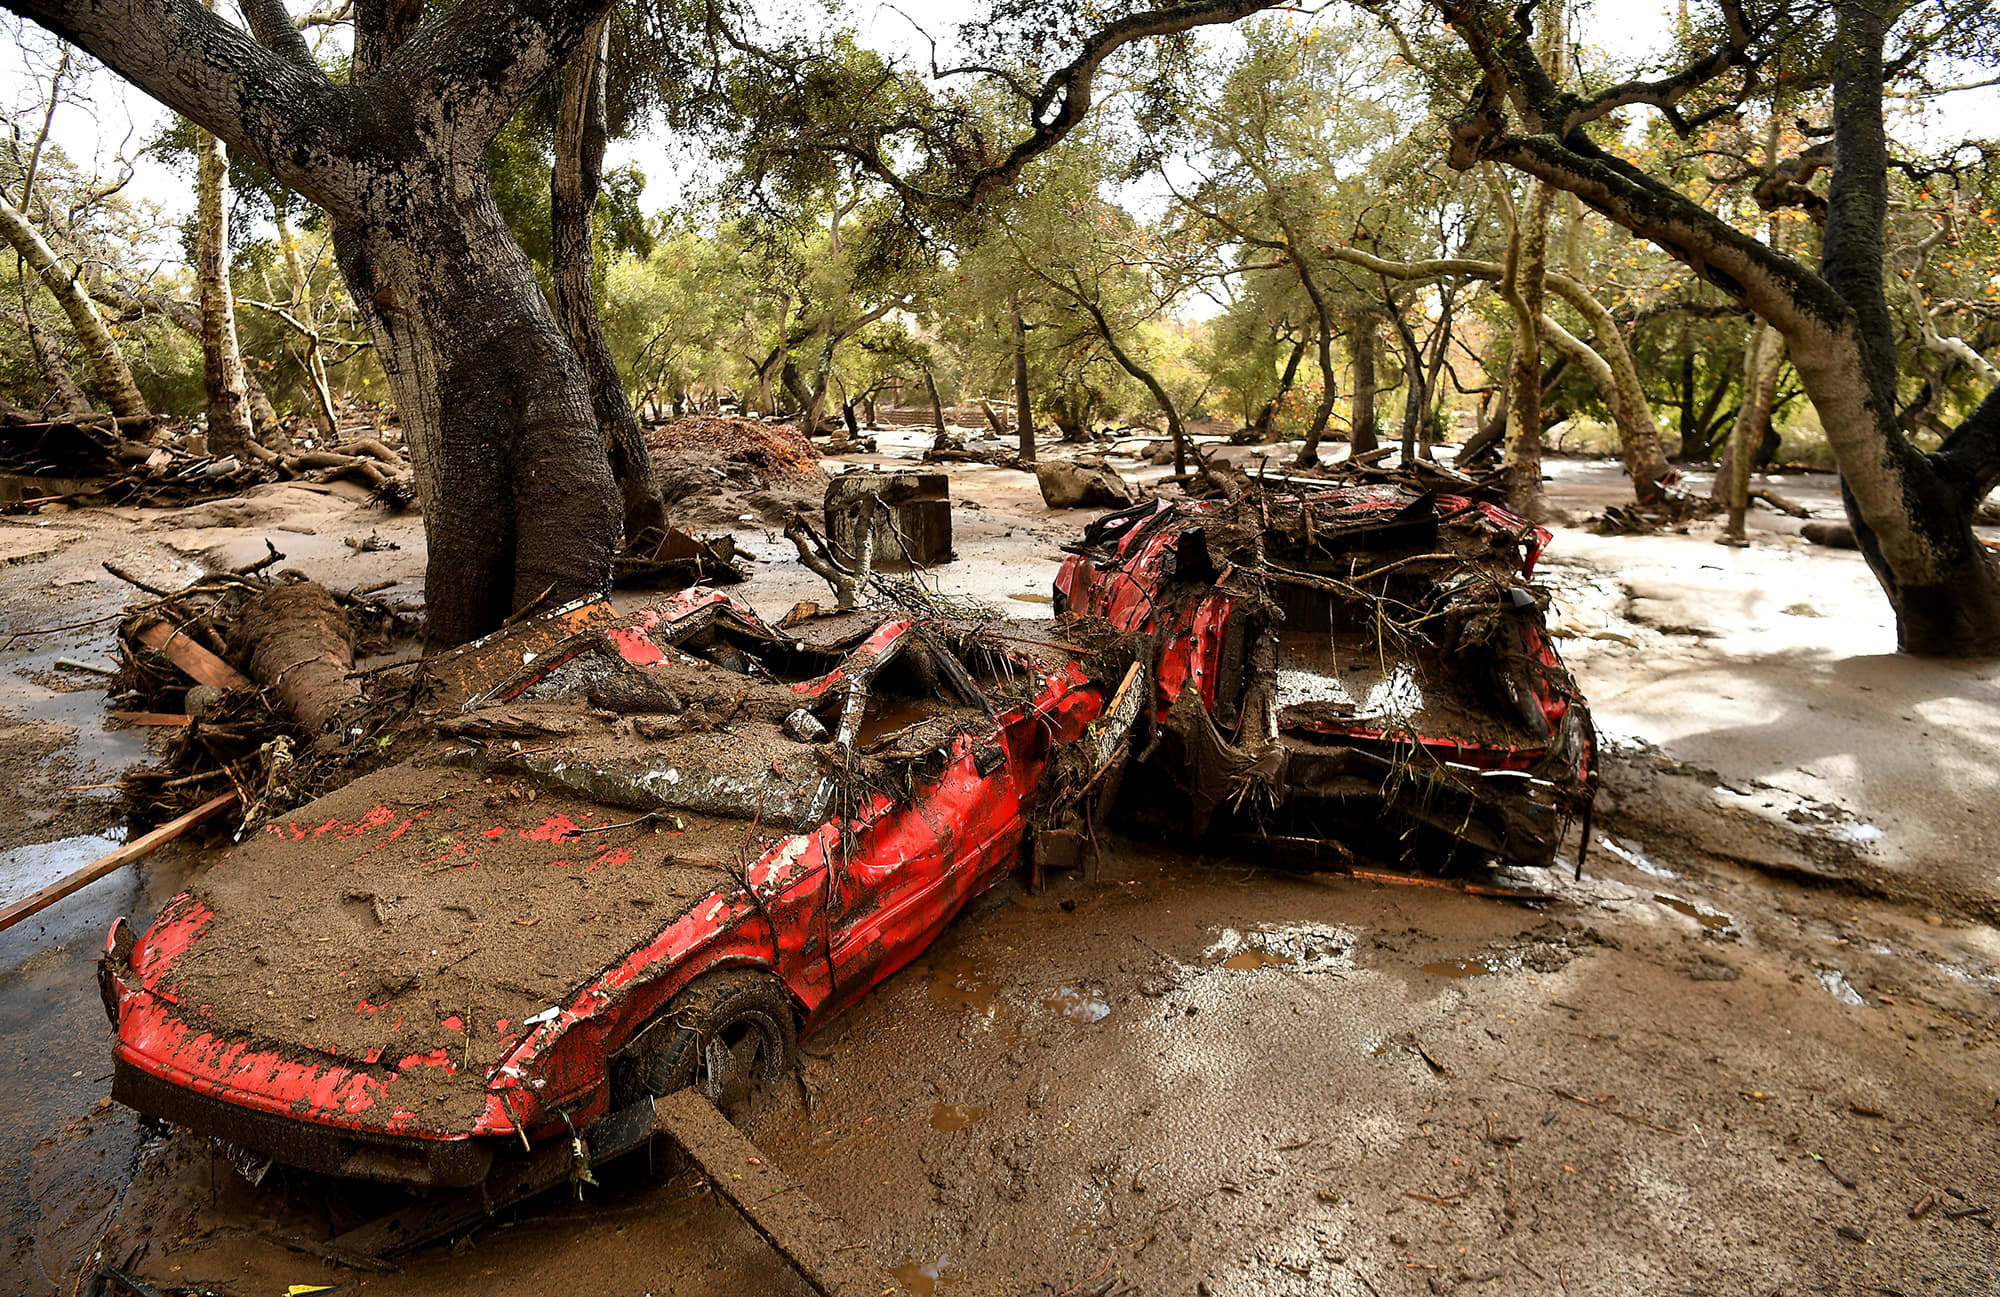
How duration changes the rating
Imagine two scenarios along the same stretch of coast and mountains:
- Event A: Very strong IVT for a short window, then the plume shifts south. You might see a sharp burst of heavy rain and wind, but less time for rivers to respond.
- Event B: Slightly lower peak IVT, but it stays aimed at the region for an extra day. Rivers have time to rise, hillsides have time to saturate, and the flood threat can grow.
CW3E’s scale is built to capture that difference so that a “moderate” event does not get underestimated just because its peak number is not the highest.
How to use the AR scale
If you see an AR category mentioned in a forecast, a helpful way to interpret it is:
- Cat 1 to 2: Often a water-supply story, with localized hazards.
- Cat 3: Pay attention to details like storm track, snow level, and whether the region is already wet.
- Cat 4 to 5: Plan for disruptive impacts. Even well-prepared areas can see flooding, landslides, closures, and outages.
And always pair the category with local context. A Category 2 hitting a recent burn scar can be far more dangerous than the same rating elsewhere.
FAQ
Is the AR Category scale the same everywhere?
The scale is based on IVT and duration, which are meteorological quantities that can be computed anywhere. It was developed with strong emphasis on the U.S. West Coast, where atmospheric rivers are especially consequential, but the underlying idea is general.
Does AR Category tell you exactly how much rain will fall?
No. IVT tells you how much water vapor is being transported, not exactly how much will fall as rain or snow at your location. Local precipitation depends on terrain, storm structure, temperature, and where the strongest lift occurs.
Can a lower-category AR still cause flooding?
Yes. Flooding can happen with lower categories when conditions are primed, such as saturated soils, a warm storm that melts snow, or repeated storms in quick succession.
Why do I sometimes hear different categories for the same storm?
Category can vary by location and time within the same event, because IVT is not uniform across the entire atmospheric river. Forecasts may also update as new data changes expectations for peak IVT or duration.
The takeaway
CW3E’s 1 to 5 atmospheric river scale is a compact way to summarize a big idea: how intense the moisture transport is, and how long it lasts. Lower categories often lean beneficial. Higher categories more often lean hazardous. The pivot point is usually not just strength, but persistence, plus the local setup on the ground.
Curiosity satisfied, at least until the next plume shows up offshore.