Curiosity, with all its quills showing.
Some parts of Earth’s climate behave like a quick drumbeat. Others move more like a long, slow tide. The Pacific Decadal Oscillation, or PDO, belongs to the slow category: a pattern of sea surface temperature anomalies in the North Pacific that can persist for years. It is not a single storm, not a single winter, and not the same thing as El Niño. But it can quietly tilt the odds for what the West Coast feels and what North Pacific ecosystems can support.
What the PDO is
The Pacific Decadal Oscillation is a recurring pattern in North Pacific sea surface temperatures. “Recurring” does not mean clockwork. The PDO does not flip on a fixed schedule. Instead, it tends to spend stretches of time mostly in one configuration, then transition and spend another stretch mostly in the opposite configuration.
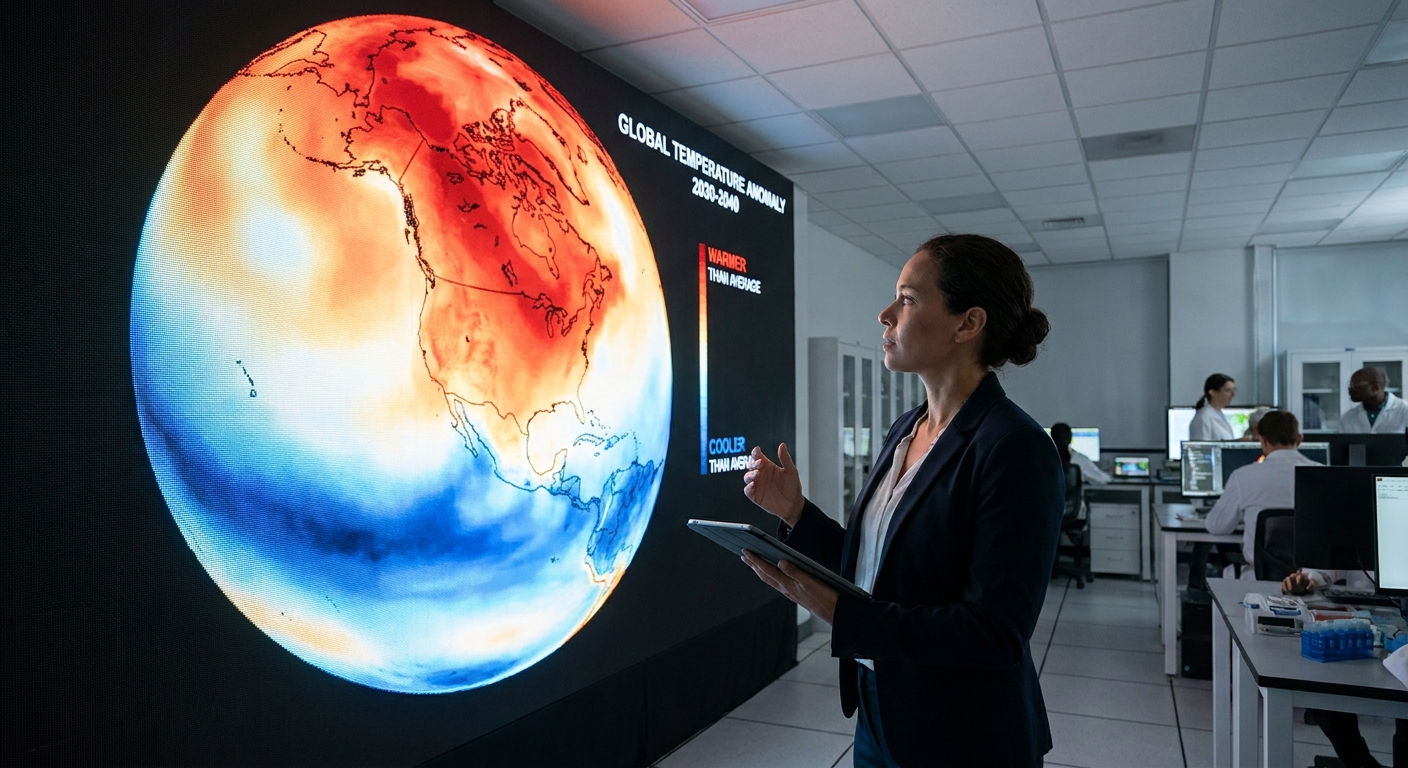
Scientists describe the PDO using a PDO index, a number that summarizes whether the North Pacific sea surface temperature pattern looks more like one phase or the other. When the index is positive, it is commonly called the warm phase. When negative, the cool phase. Those names can be misleading if you picture the whole ocean simply warming or cooling everywhere. The key is that it is a pattern, with some areas warmer than average while others are cooler than average.
Warm vs cool
The PDO is often explained as a basin-wide see-saw in the North Pacific. The exact temperature anomalies vary from event to event, but the classic descriptions look like this:
Warm (positive) phase
- Warmer than average sea surface temperatures often show up along the west coast of North America and into the Gulf of Alaska.
- Cooler than average waters tend to appear farther west and toward the central North Pacific.
Cool (negative) phase
- Cooler than average waters are more common along the west coast of North America and into the Gulf of Alaska.
- Warmer than average waters tend to appear farther west and in the central North Pacific.
Two important footnotes:
- The PDO is most evident in the cool season. The pattern’s variance is typically largest in boreal winter, when North Pacific atmosphere-ocean coupling and mixing help these anomalies show up more clearly.
- “Warm” and “cool” refer to anomalies. A “warm phase” does not guarantee warm conditions on land everywhere, and it does not override long-term global warming trends.
PDO vs El Niño and La Niña
The PDO and ENSO both involve ocean temperatures in the Pacific, and both can influence weather. That similarity is exactly why they are often mixed up. Here is the cleanest separation:
Where they happen
- ENSO is centered in the tropical Pacific, near the equator.
- PDO is centered in the North Pacific, roughly poleward of 20°N.
How long they last
- ENSO typically evolves over months and often peaks within a year, though impacts can persist across seasons.
- PDO tends to persist on multi-year to decadal timescales, with occasional longer-lasting periods. Its index can still swing year to year, especially when the tropics are loud.
What drives them
- ENSO is tightly linked to tropical ocean-atmosphere feedbacks along the equator, including trade winds and changes in the thermocline.
- PDO reflects a mix of influences, including atmospheric variability over the North Pacific and how the ocean stores and releases heat over longer timescales. ENSO can also “project” onto the North Pacific, meaning a strong El Niño or La Niña can temporarily make the North Pacific look more like one PDO phase.
Why they get tangled
During some periods, the PDO phase and ENSO state line up in ways that reinforce certain impacts, and during other periods they work against each other. That is part of why two different El Niño winters can feel surprisingly different on the West Coast. The tropics may set the stage, but the North Pacific can tweak the lighting.
How it shapes West Coast climate
The PDO is not a day-to-day weather maker. It does not “cause” a specific storm to form on a specific Tuesday. Instead, it can shift probabilities in the background by nudging storm tracks, regional pressure patterns, and the way the ocean exchanges heat and moisture with the atmosphere.
Commonly discussed connections include:
- Rain and snow patterns: PDO phase can modulate how stormy or calm certain multi-year stretches feel along parts of the West Coast and western Canada, especially when combined with ENSO.
- Temperature tendencies: When coastal waters are warmer than average, nearby land areas can lean milder in some seasons, though topography and short-lived weather patterns still dominate what any given city experiences.
- Coastal ocean conditions: PDO-related circulation patterns and SST anomalies are associated with shifts in the coastal marine environment, including periods that coincide with weaker or stronger upwelling-favorable winds in some regions and seasons. Upwelling itself is primarily wind-driven, but the broader background state can matter.
If you are looking for certainty, the PDO will disappoint you. If you are looking for loaded dice, it is more helpful. Climate modes like the PDO do not write the whole script, but they can change which scenes are more likely.
One careful way to picture the “scenes,” without pretending this is a guarantee: during some positive PDO periods, Alaska tends to skew milder and wetter while parts of the Pacific Northwest and the West Coast can see storm-track tendencies that differ from negative PDO stretches. The details vary by season, by location, and by whatever ENSO is doing at the same time.
Why fisheries care
The North Pacific is an engine room for marine life, and many species are sensitive to temperature, nutrients, and the timing of seasonal mixing. Because the PDO is tied to large-scale sea surface temperature patterns, it is often studied alongside shifts in:
- Upwelling and nutrient supply along the West Coast
- Plankton communities, which form the base of the marine food web
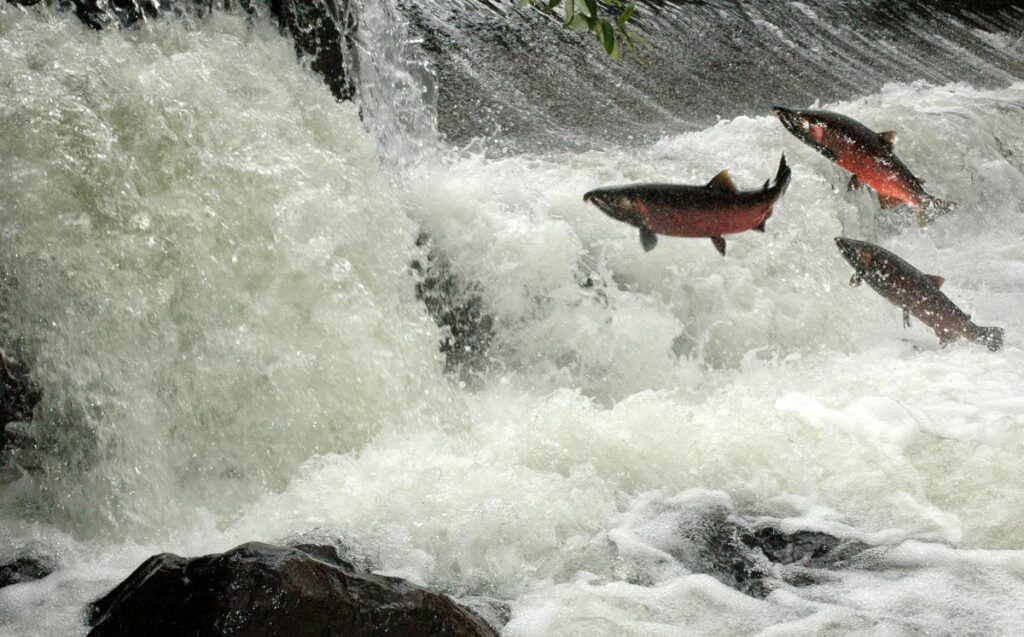
- Salmon survival and distribution in the North Pacific
- Recruitment of commercially important fish, where ocean conditions during early life stages can matter a great deal
One useful way to think about it is that the PDO can influence the background habitat over long stretches of time. Fisheries management still depends on stock assessments, harvest rules, and many local factors, but understanding multi-year ocean regimes can help interpret why certain periods are tough or bountiful.
How the PDO is measured
You will often hear “PDO index” in reports and papers. That index is a compact way of summarizing a complicated map of sea surface temperatures.
In broad strokes, researchers:
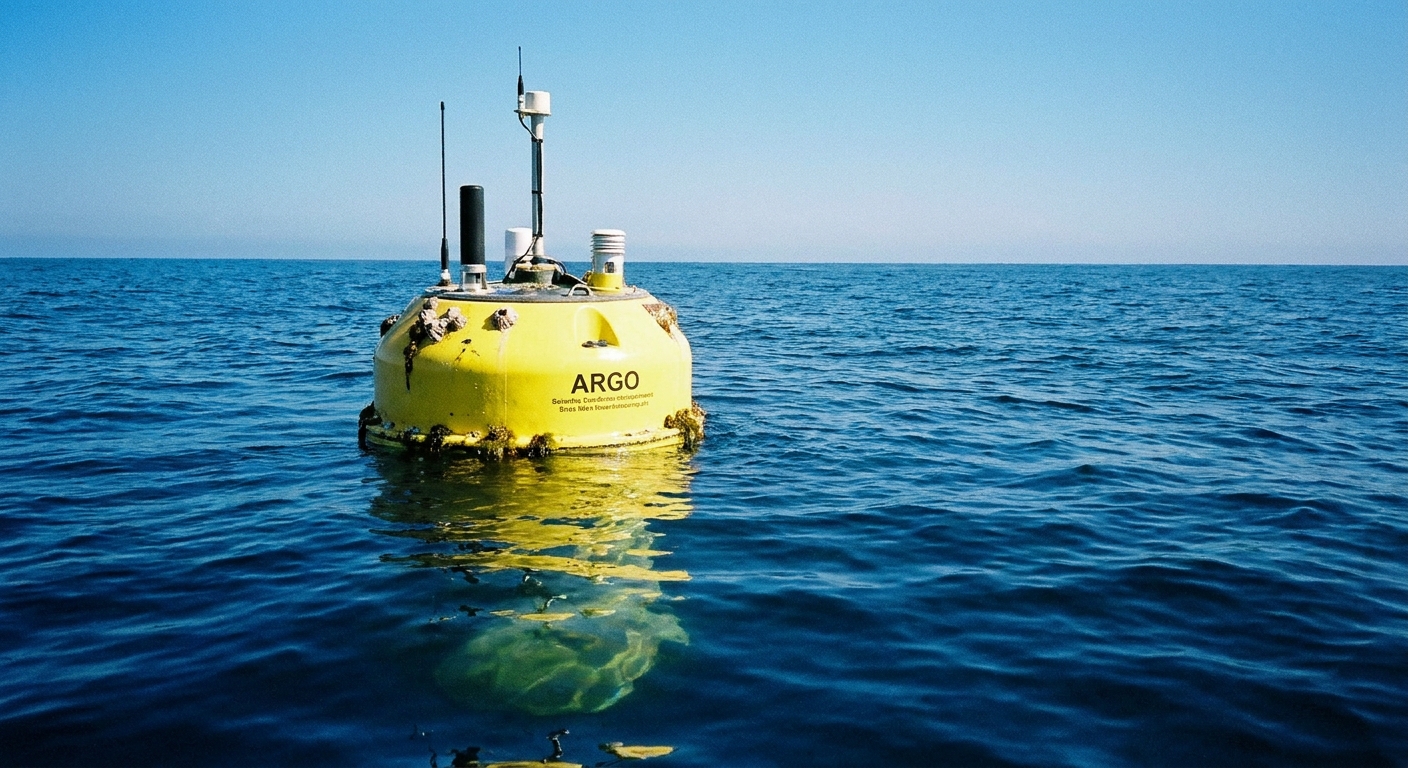
- Start with North Pacific sea surface temperature observations (from ships, buoys, and satellites, often combined in datasets).
- Remove the average seasonal cycle so January is compared with Januaries, July with Julys, and so on.
- Extract the dominant spatial pattern of variability in the North Pacific and track how strongly each month resembles that pattern over time. The resulting time series is the index, which can be positive or negative.
In many definitions, that dominant pattern is the leading empirical orthogonal function (EOF) of North Pacific SST anomalies poleward of about 20°N. Some versions also remove the global mean SST anomaly first, which helps separate basin-scale “pattern” variability from the planet’s overall warming signal.
Because methods and datasets differ, you may see slightly different PDO index series depending on the source. If you want a canonical place to look, the PDO index is commonly associated with the University of Washington’s Joint Institute for the Study of the Atmosphere and Ocean (JISAO), and PDO-related datasets and explanations are also circulated through NOAA channels.
PDO and climate change
No. The PDO is primarily an expression of natural variability within the ocean-atmosphere system. It can redistribute heat within the Pacific and influence regional climate patterns, but it does not create the long-term, planet-wide warming trend seen over the last century.
What it can do is complicate the view at shorter time horizons. If you are looking at a decade or two of regional conditions, a PDO phase can make warming appear faster in one period and slower in another, even as the long-term trend continues.
PDO questions
How long does a PDO phase last?
Often years, sometimes a decade or more, but there is no fixed duration. The PDO is best treated as a tendency for the North Pacific to linger in one dominant pattern for a while before shifting.
Can the PDO predict next winter?
Not reliably on its own. The PDO is more useful for understanding background conditions than for pinpointing seasonal outcomes. For winter forecasts, ENSO state, shorter-lived atmospheric patterns, and evolving ocean conditions are typically more predictive.
Is the PDO the same as a regime shift?
They are related but not identical. A “regime shift” usually refers to a broader, ecosystem-wide change in the ocean-atmosphere system. PDO transitions are sometimes discussed as part of those shifts because they can coincide with wide-reaching changes in ocean conditions.
Is the PDO always either warm or cool?
No. The index can hover near zero, and the spatial pattern can be messy. Real oceans rarely match textbook patterns perfectly.
The takeaway
The Pacific Decadal Oscillation is a long-lived pattern of North Pacific sea surface temperature anomalies that flips between a warm (positive) and cool (negative) phase. It is not the same as El Niño and La Niña, which are tropical and usually shorter-lived, but it can interact with ENSO and modulate the climate odds along the West Coast. For fisheries and marine ecosystems, the PDO matters because multi-year ocean temperature patterns can shape the conditions that marine life depends on.
In other words: if ENSO is a loud conversation in the tropics, the PDO is the North Pacific’s slow, steady tone in the background. Both can matter. They just speak on different timescales.