
One of my favorite classroom tricks was asking students a deceptively simple question: “Is 70°F warm?” Half the room would nod, the other half would shrug. Someone from Arizona would say it is chilly. Someone from Maine would call it T-shirt weather. Same number, different meaning.
That is exactly why climate scientists lean so heavily on temperature anomalies. An anomaly is not a fancy word for “weird data.” It is a practical way to say: compared to what is normal for this place and time, how different is today, this month, or this year?
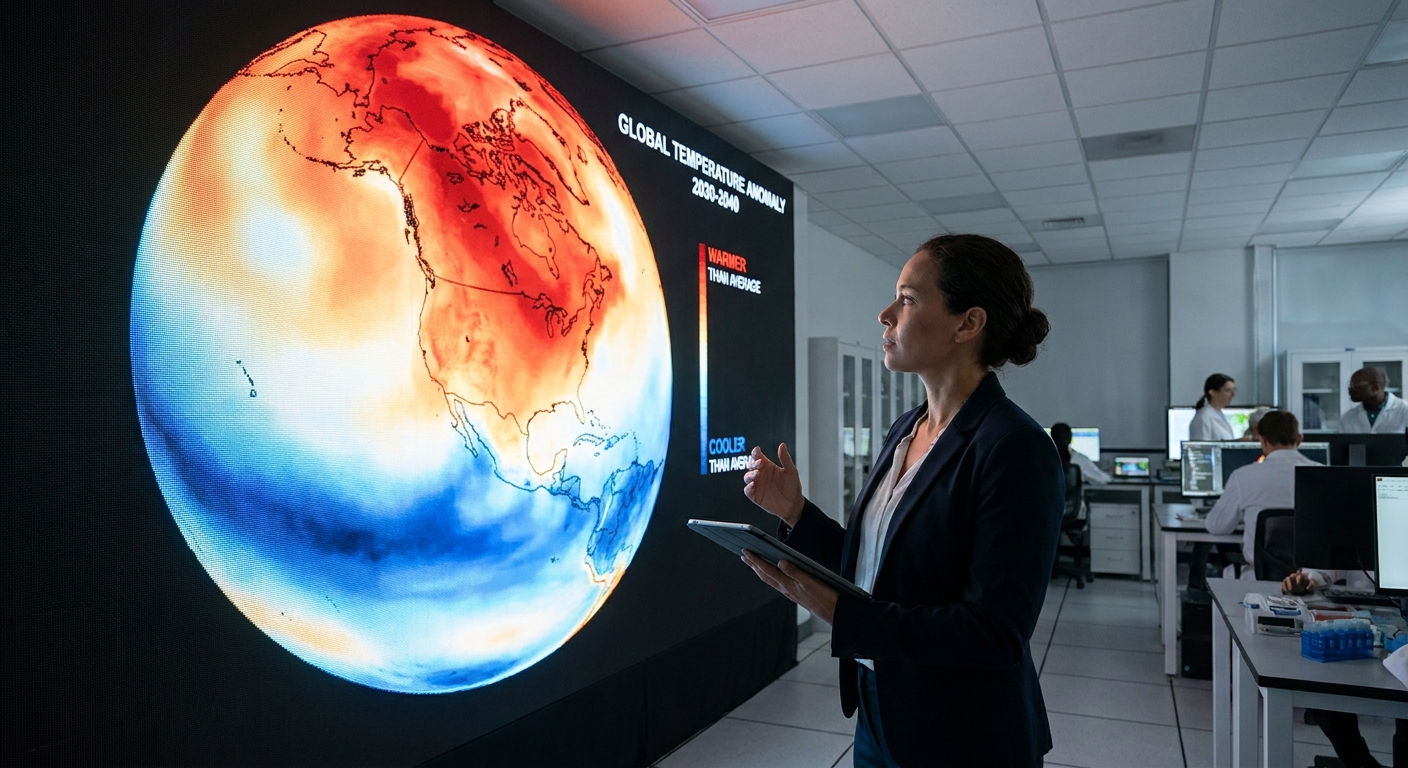
The definition in plain language
A temperature anomaly is:
- Observed temperature minus a chosen baseline average.
Written as an equation:
Temperature anomaly = Observed temperature − Baseline averageIf the anomaly is positive, it means it was warmer than the baseline. If it is negative, it was cooler than the baseline.
A quick example
Imagine a town where the average July afternoon temperature (based on a baseline period) is 86°F. This July, the average afternoon temperature is 90°F.
- Anomaly = 90 − 86 = +4°F
That +4°F tells you “how unusual” the warmth was, without needing you to know whether that town is normally hot, mild, or cold.
What is the baseline, exactly?
The baseline is a reference average chosen for comparison. In climate work, it is often a multi-decade period that represents “typical” conditions for that location and time of year. You will commonly see baselines like 1951 to 1980 or 1991 to 2020, depending on the agency or dataset.
Two important details:
- Baselines are not laws of nature. They are conventions chosen to make comparisons consistent.
- Baselines are usually seasonal. July is compared to past Julys, January to past Januarys. That avoids the obvious issue that July is naturally warmer than January in many places.
Why scientists use anomalies instead of raw temperatures
If you are comparing climates across Earth, raw temperatures can be misleading.
1) Anomalies let you compare very different climates
A 2°F warm-up in a coastal city that usually sits at 60°F and a 2°F warm-up in a desert city that usually sits at 95°F are both “+2°F anomalies.” The climates are different, but the departure from normal is directly comparable.
2) Anomalies reduce some measurement quirks
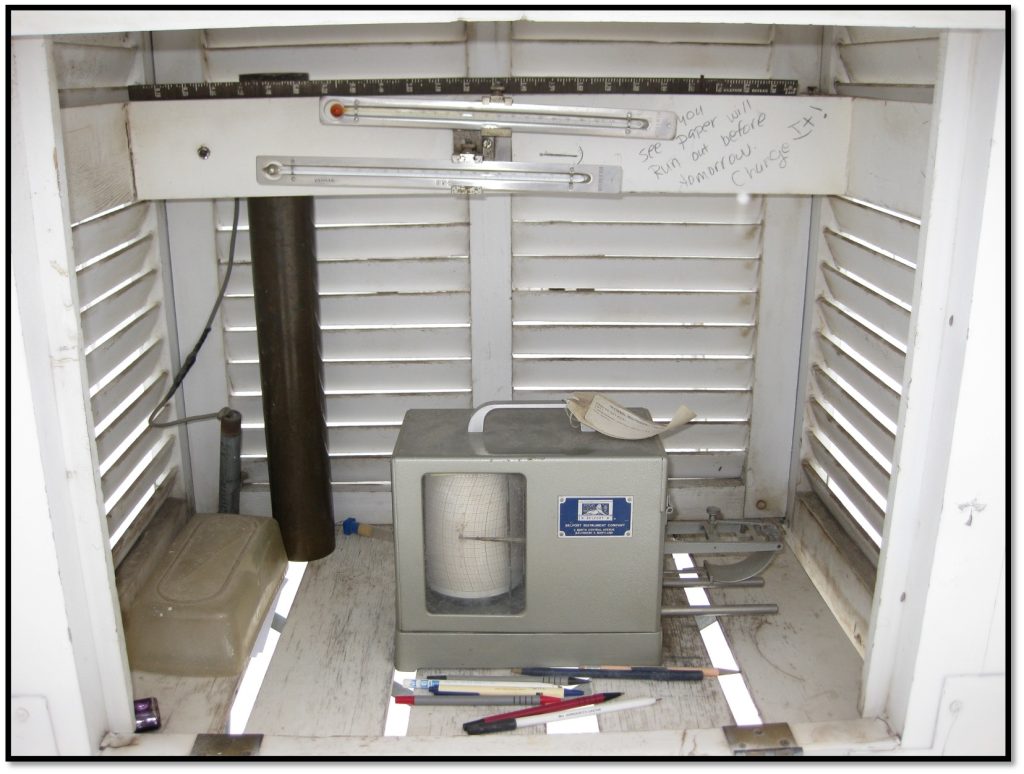
Different stations have different elevations, surroundings, sensor models, and histories. Those factors can shift absolute temperature readings a bit. When you convert to anomalies, many of those site-specific offsets matter less, because you are focusing on changes relative to that station’s own typical conditions.
3) Anomalies make maps and trends clearer
When you are trying to see patterns like heat waves, ocean warming, or long-term global change, anomaly maps highlight the signal you care about: where it is unusually warm or cool compared to a reference.
How to read a red and blue temperature anomaly map
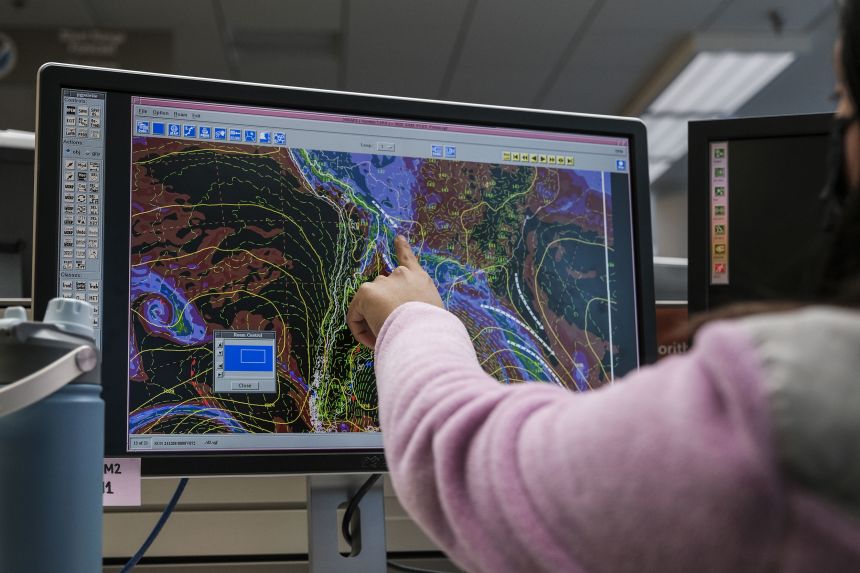
Those familiar climate maps with red and blue patches are usually departure maps, meaning they show anomalies, not the actual temperature.
Step 1: Check the units
Anomalies may be shown in °C or °F. For a quick gut-check: 1°C of anomaly is 1.8°F.
Step 2: Use the color bar, not your instincts
Most maps use:
- Reds for warmer than the baseline (positive anomaly)
- Blues for cooler than the baseline (negative anomaly)
Darker shades usually mean a larger departure. But color scales vary, so always look at the legend.
Step 3: Remember what the map is not saying
A common misunderstanding is: “Red means hot.” Not necessarily. Red means hotter than usual for that place and time.
A winter day in Alaska can show a strong red anomaly and still be below freezing. Meanwhile, a desert region can show a near-zero anomaly and still be blazing hot. The map is answering “unusual compared to normal,” not “comfortable for humans.”
Does changing the baseline change the anomaly?
Yes. And this is where people sometimes get suspicious for the wrong reason.
If you change the baseline period, you change the average you are subtracting. That can shift all anomalies up or down.
What changes
- The anomaly number can change because the reference average changed.
- The zero point moves. A newer baseline in a warming world is often warmer than an older baseline, so anomalies measured relative to it may look smaller.
What does not change
- The underlying observations do not change. The thermometer readings, satellite measurements, and ocean buoy data are the same.
- The physical reality does not change. A heat wave is still a heat wave. The baseline only changes the yardstick.
A baseline thought experiment
Say a city’s July baseline average was 80°F for 1951 to 1980. Later, using 1991 to 2020, the July baseline average becomes 82°F, because recent decades were warmer.
If this year’s July average is 84°F:
- Relative to the older baseline: anomaly = 84 − 80 = +4°F
- Relative to the newer baseline: anomaly = 84 − 82 = +2°F
Same July. Same observed 84°F. Different “normal.”
What about global temperature anomalies?
When you see headlines about global temperature anomaly, it usually refers to the average temperature departure over Earth’s surface (often combining land air temperatures and sea surface temperatures), compared with a baseline period.
Because Earth is huge and unevenly measured, datasets use careful methods to combine many observations into a single global number. But the basic idea remains the same: global observed average minus global baseline average.
One reason anomalies are so useful globally is that places with very different typical climates can still be combined meaningfully. The anomaly approach focuses on changes relative to local normals before those changes are averaged across the planet.
Common misconceptions
An “anomaly” does not mean an error
In everyday speech, “anomaly” can imply something fishy. In climate science, it is simply a difference from a reference average.
A small anomaly can still matter
Over a whole region or the whole globe, even a 0.5°C shift is enormous in terms of energy. It can influence heat stress, drought risk, snowpack, coral bleaching, and the odds of extreme events.
Cold anomalies still happen in a warming world
A warming trend raises the background level, but weather still wiggles around. You can have a colder-than-average week in one place even while the long-term global average rises.
FAQ
Is a temperature anomaly the same as “temperature departure”?
Usually, yes. “Departure” is a very common label on maps and forecast products, and it typically means observed minus average for a selected baseline.
Are anomalies always based on 30 years?
Not always, but 30-year periods are widely used for climate normals because they smooth out year-to-year noise while still representing a modern climate state. Different institutions may choose different periods for different purposes.
Can anomalies be negative?
Absolutely. A negative anomaly means cooler than the baseline average for that place and time.
Which baseline is “correct”?
The best baseline depends on the question. If you are studying long-term change, an older baseline can make the shift easier to see. If you want “normal for right now,” a recent baseline may be more practical. The key is to state the baseline clearly so comparisons are honest.
The takeaway
A temperature anomaly is a simple subtraction with a big payoff: it turns “70°F is warm or cold depending on who you ask” into a clearer statement, like “this month was 3°F warmer than normal.” That lets scientists compare different regions, spot patterns on red and blue maps, and track change over time.
And if you ever see the baseline period change, remember: the yardstick moved, not the thermometer.