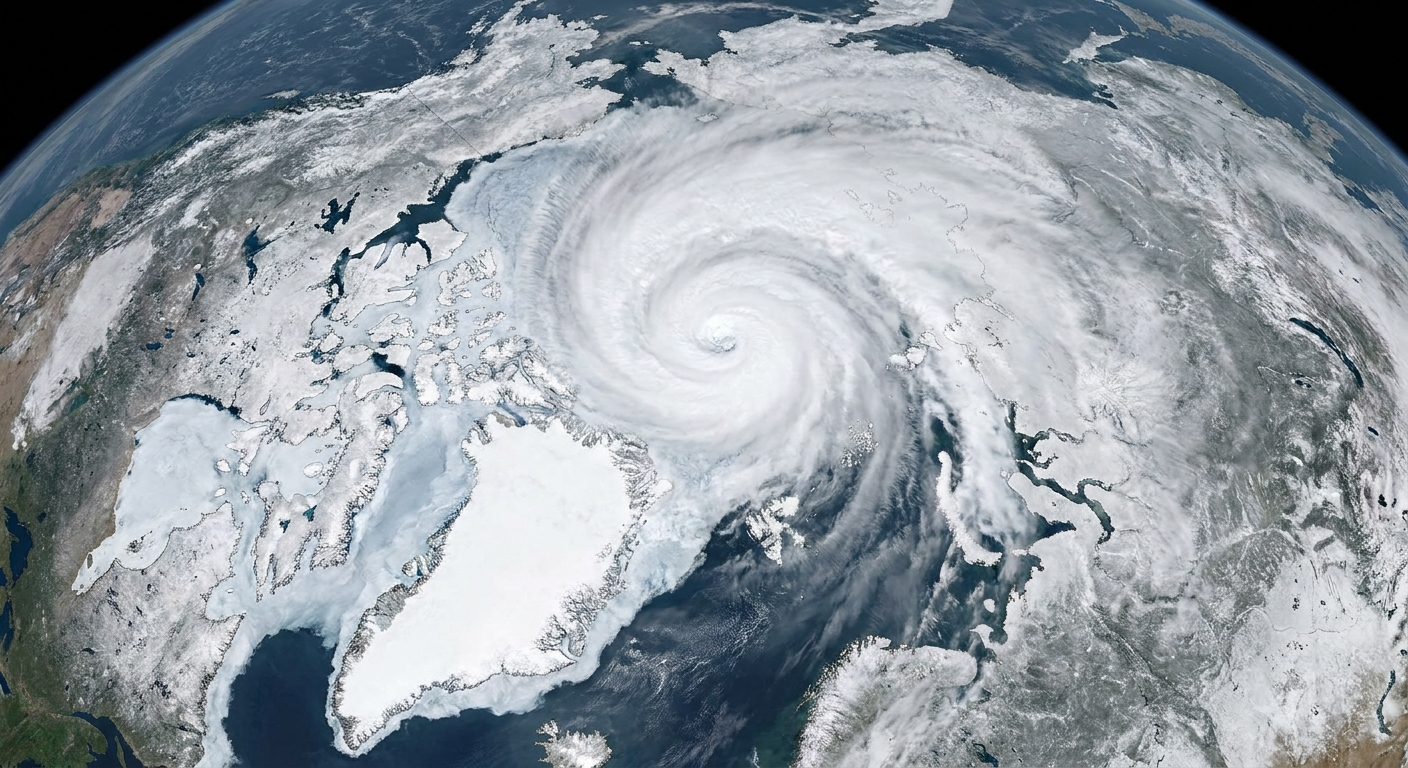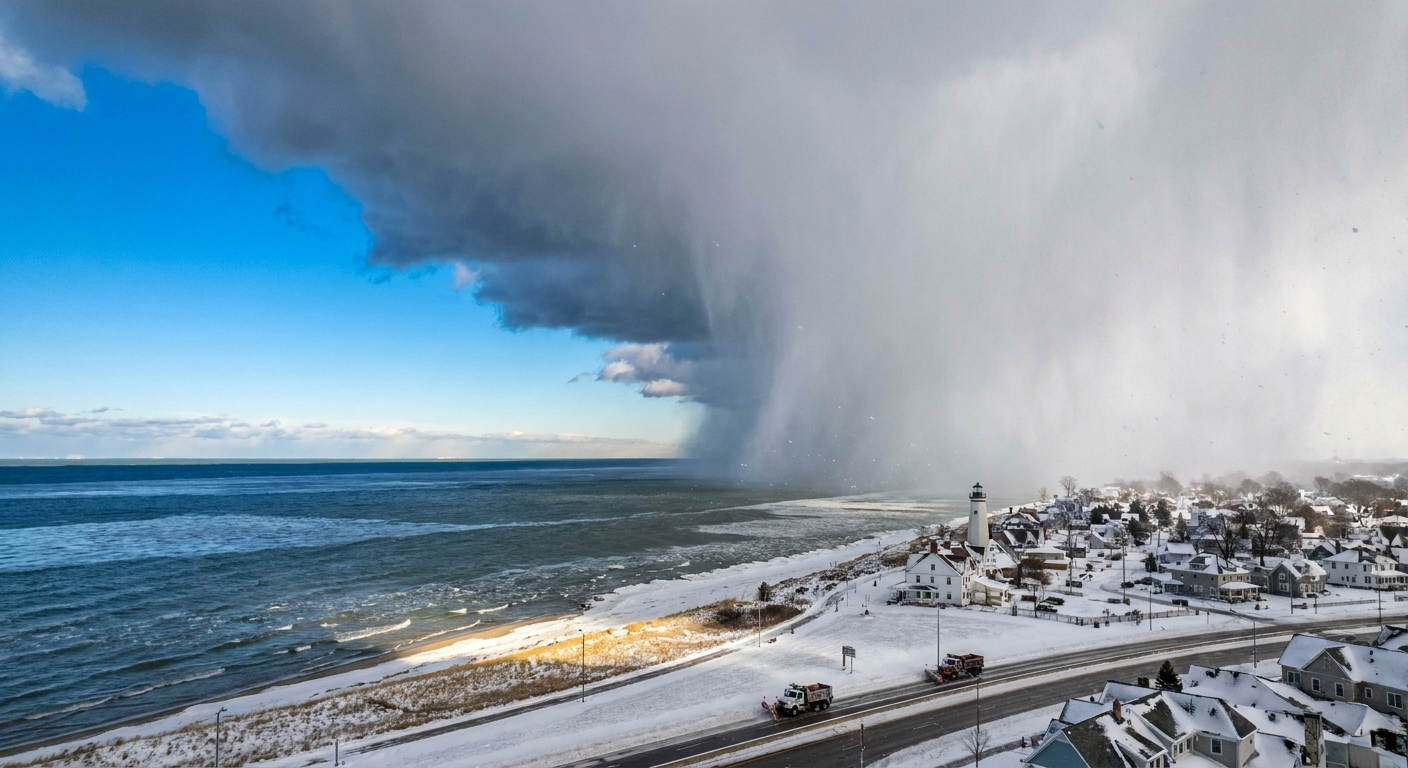
If you have ever heard a forecast say “the Arctic Oscillation is positive” and wondered if that is just another way of saying “polar vortex,” you are not alone. In my classroom days, this is exactly the kind of mix-up that would trigger a chorus of excellent questions. The short version is this: the Arctic Oscillation, or AO, is a near-surface pressure pattern across the Northern Hemisphere. It is measured with an index, and it helps describe whether cold Arctic air tends to stay bottled up near the pole or has an easier path into the mid-latitudes.

Importantly, the AO is not the same thing as the stratospheric polar vortex, which is a ring of fast winds tens of kilometers up in the stratosphere. The AO lives closer to where we live, in the patterns of sea level pressure and near-surface winds.
Arctic Oscillation, defined
The Arctic Oscillation is commonly described as a pressure contrast, or “see-saw,” between:
- Pressure anomalies over the Arctic (higher or lower than average)
- The opposite-signed tendency in the northern mid-latitudes, roughly the band of Earth between about 30°N and 60°N
Because air moves in response to pressure differences, that contrast matters. It influences the strength and shape of the belt of westerly winds that tends to circle the Northern Hemisphere and the boundaries that help corral cold air.
A helpful mental image is to think of the AO as describing whether the atmosphere is set up more like a tight, sturdy fence around the Arctic or a wavier, leakier fence that makes it easier for cold air to spill south and for warm air to surge north.
AO phases
The AO index is usually discussed in two phases, positive and negative. Neither phase guarantees a specific weather event in your backyard, but each phase can tilt the odds in recognizable ways.
Positive Arctic Oscillation (AO+)
In a positive AO, surface pressure tends to be lower than average over the Arctic and higher than average in the mid-latitudes.
- What it often implies: a stronger, more zonal (west-to-east) flow that helps keep the coldest Arctic air more contained near the pole.
- Typical mid-latitude flavor: it can favor a steadier west-to-east storm track overall and fewer large, repeated southward plunges of Arctic air.
“Contained” does not mean “no winter.” It means the broad-scale setup is less favorable for repeated deep cold-air outbreaks into the mid-latitudes.
Negative Arctic Oscillation (AO-)
In a negative AO, surface pressure tends to be higher than average over the Arctic and lower than average in the mid-latitudes.
- What it often implies: weaker westerlies and a wavier jet stream pattern that can open pathways for cold Arctic air to push south in lobes.
- Typical mid-latitude flavor: a higher chance of blocking patterns and more frequent cold-air outbreaks in some regions.
This is the phase people usually have in mind when they talk about “Arctic air escaping.” The key word is pathways. The cold air does not ooze out evenly like fog. It tends to surge along specific routes depending on the whole atmospheric pattern at the time.
One concrete example: when AO is negative, it can coincide with higher pressure blocking near Greenland, which can favor colder-than-normal stretches in parts of eastern North America and northern Europe. That is a tendency, not a promise.

How the AO index is made
The AO is not a single storm, front, or temperature reading. It is an index, meaning a number designed to summarize a big, messy map of atmospheric conditions into something trackable over time.
At its core, the AO index is built from surface pressure patterns, typically using sea level pressure (SLP) observations and reanalysis datasets that blend observations with physics-based models.
The pattern behind the number
Meteorologists look at how sea level pressure deviates from what is normal for that time of year. In technical terms, the AO is often computed as the leading pattern (EOF) of Northern Hemisphere sea level pressure anomalies, and the daily index value tells you how strongly the atmosphere is matching that pattern.
When the atmosphere resembles the AO “positive” pattern, the index goes positive. When it resembles the “negative” pattern, the index goes negative. When it resembles neither strongly, the index sits near zero.
What “anomaly” means here
An anomaly is just “different from average.” A sea level pressure anomaly map answers questions like: Is pressure over the Arctic higher or lower than it usually is in January? What about over the North Atlantic, the North Pacific, and the continents?
By focusing on anomalies, the index emphasizes patterns rather than the fact that winter pressure values are naturally different from summer values.
Why forecasts talk about it
Because the AO captures a hemisphere-scale pressure setup, it can be useful for:
- Context: explaining why the jet stream is behaving in a more “straight” or more “wavy” way
- Risk framing: highlighting when the large-scale pattern is more or less supportive of cold-air outbreaks into the mid-latitudes
- Week-to-week outlooks: adding one more clue to the puzzle, especially in winter
If you like to check the current value, NOAA’s Climate Prediction Center (CPC) posts AO index charts and outlooks that show where the index has been and where it may be headed.
AO vs. NAO
A very common point of confusion is between the Arctic Oscillation (AO) and the North Atlantic Oscillation (NAO).
The NAO is focused specifically on the North Atlantic sector and is often described as the pressure difference between the region near Iceland (the Icelandic Low) and the Azores (the Azores High). That makes it a different index from the AO, even though the two can be related in practice because they both reflect large-scale circulation patterns in the Northern Hemisphere.
- AO: broader, hemispheric surface pressure pattern
- NAO: regional North Atlantic pressure pattern (Iceland and Azores)
If you are scanning winter outlooks, a good rule of thumb is: AO tells you about the big, hemisphere-wide setup, while NAO zooms in on the North Atlantic “steering wheel” that can strongly shape weather in eastern North America and Europe.

AO vs. polar vortex
Let’s keep this clean and honest, because the terminology gets tangled fast.
The Arctic Oscillation is a surface pressure pattern index.
The stratospheric polar vortex is a high-altitude wind structure.
They can interact, especially in winter, but they are not synonyms. A headline about the polar vortex might be discussing what is happening in the stratosphere tens of kilometers above the ground. A discussion of the AO is specifically about how sea level pressure is arranged across the Arctic and mid-latitudes.
If you want one practical takeaway: when you see AO strongly negative, it suggests the near-surface pattern is more favorable for cold air to take excursions southward. That is different from making any specific claim about the state of the stratospheric vortex.
You may also see the term Northern Annular Mode (NAM). In many contexts, the AO is essentially the near-surface expression of the NAM framework, which describes similar north to south shifts in atmospheric mass and winds across different heights.
What the AO does not tell you
As useful as the AO is, it is not a weather fortune teller. Here are a few limits worth keeping in mind.
- It does not specify your local temperature. Two different negative AO periods can produce very different outcomes depending on where ridges and troughs set up.
- It does not guarantee snow. Cold air is one ingredient. Moisture and storm track matter just as much.
- It does not act alone. Other patterns like ENSO (El Niño and La Niña), the NAO, the Pacific-North American pattern (PNA), and shorter-lived blocking events can all reshape what you actually experience.
In teacher terms, think of the AO as a big background setting on the atmosphere’s control panel. It can make certain outcomes more likely, but it does not press the “snow day” button by itself.
Quick FAQ
What is the Arctic Oscillation in one sentence?
The Arctic Oscillation is an index that describes how sea level pressure is arranged between the Arctic and the northern mid-latitudes, which influences how easily cold Arctic air can shift southward.
Is a positive AO “good” and a negative AO “bad”?
Not scientifically. “Positive” and “negative” are just labels for two opposite pressure patterns. Whether it is good or bad depends on what impacts you care about, like heating demand, transportation, agriculture, or winter recreation.
What does it mean when the AO is near zero?
It usually means the atmosphere is not strongly matching either the positive or negative AO pattern. The pressure setup is more neutral, or other patterns are dominating.
Why do scientists use an index at all?
Because it is hard to compare thousands of pressure maps across decades by eyeballing them. An index turns a sprawling pattern into a time series that can be analyzed, correlated, and sometimes predicted.
The bottom line
The Arctic Oscillation is a surface pressure contrast between the Arctic and the northern mid-latitudes. In its positive phase, the setup tends to favor keeping the coldest air more concentrated near the pole. In its negative phase, the setup more often supports a wavier flow that can let cold air reach farther south in lobes.
And if you remember only one distinction, make it this: AO equals a surface pressure pattern index. It is a different tool, describing a different part of the atmosphere, than the stratospheric polar vortex.