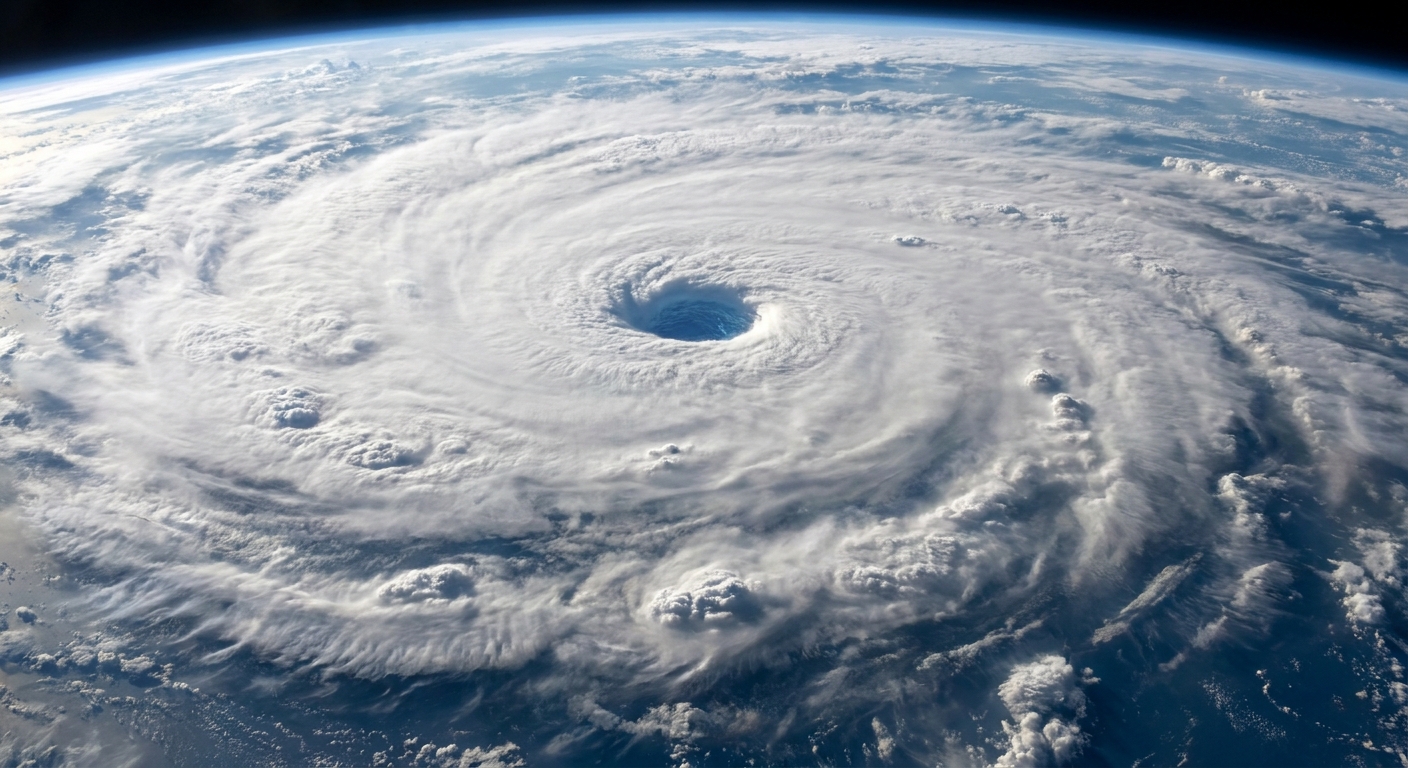
The first time I showed my physics students a looping satellite view of a hurricane, you could feel the room lean forward. The storm looked alive, like a slow pinwheel breathing over the ocean. The magic trick, though, is not the animation. It is the sensors. Weather satellites do not just “take pictures” of storms. They measure different kinds of light, from visible sunlight to infrared radiation (thermal emission) to microwaves used by certain instruments.
Put those measurements together, and you get a surprisingly complete story: where clouds are forming, how fast they are moving, how tall and cold their tops are, and, with microwave instruments and precipitation algorithms, where rain is likely falling beneath an opaque cloud shield.
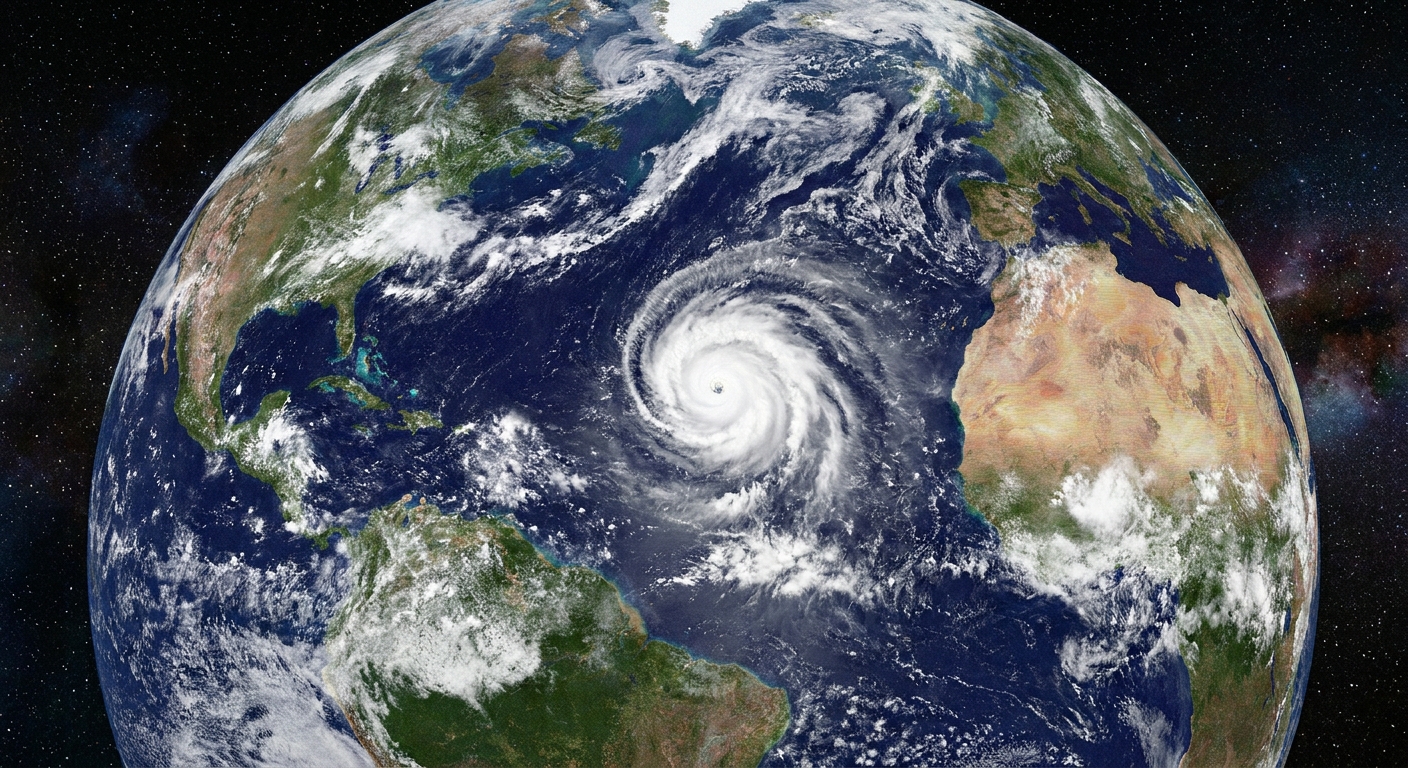
Two main vantage points: geostationary vs polar-orbiting
Before we talk sensors, it helps to know how weather satellites are positioned. Orbit shapes what they can see and how often they can see it.
Geostationary satellites: constant watch from one spot
Geostationary weather satellites orbit high above Earth’s equator, matching Earth’s rotation. From the ground, they appear to hover over one longitude. That steady view is perfect for tracking storms as they evolve minute by minute.
- Strength: rapid updates for cloud motion, storm growth, and lightning trends.
- Tradeoff: lower detail than closer satellites, and a less direct viewing angle toward the poles. Pixels also effectively stretch toward the edge of the view, so fine details get harder to resolve near the limb.
Polar-orbiting satellites: close-up passes, global coverage
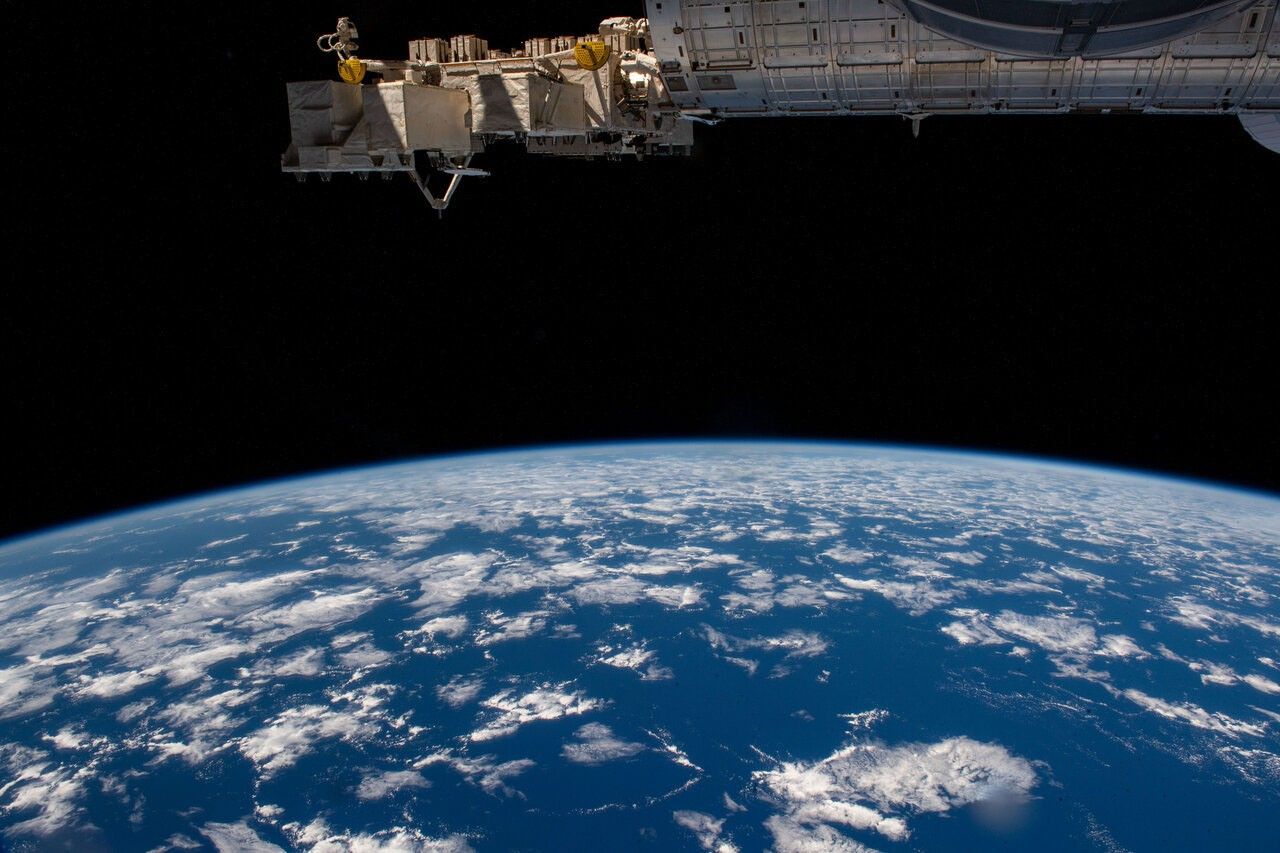
Polar-orbiting satellites fly much lower and sweep over (or near) the poles, while Earth spins beneath them. They do not stare at one storm continuously. Instead, they collect sharper snapshots and cover the whole planet over time, including high latitudes that geostationary satellites see at an angle.
- Strength: higher spatial detail and powerful instruments, including many microwave sounders and imagers.
- Tradeoff: less frequent looks at the same storm from the same satellite.
One practical note: when people talk about “microwave satellite” views of storms, they are usually talking about data from polar-orbiting satellites, not the familiar geostationary loops.
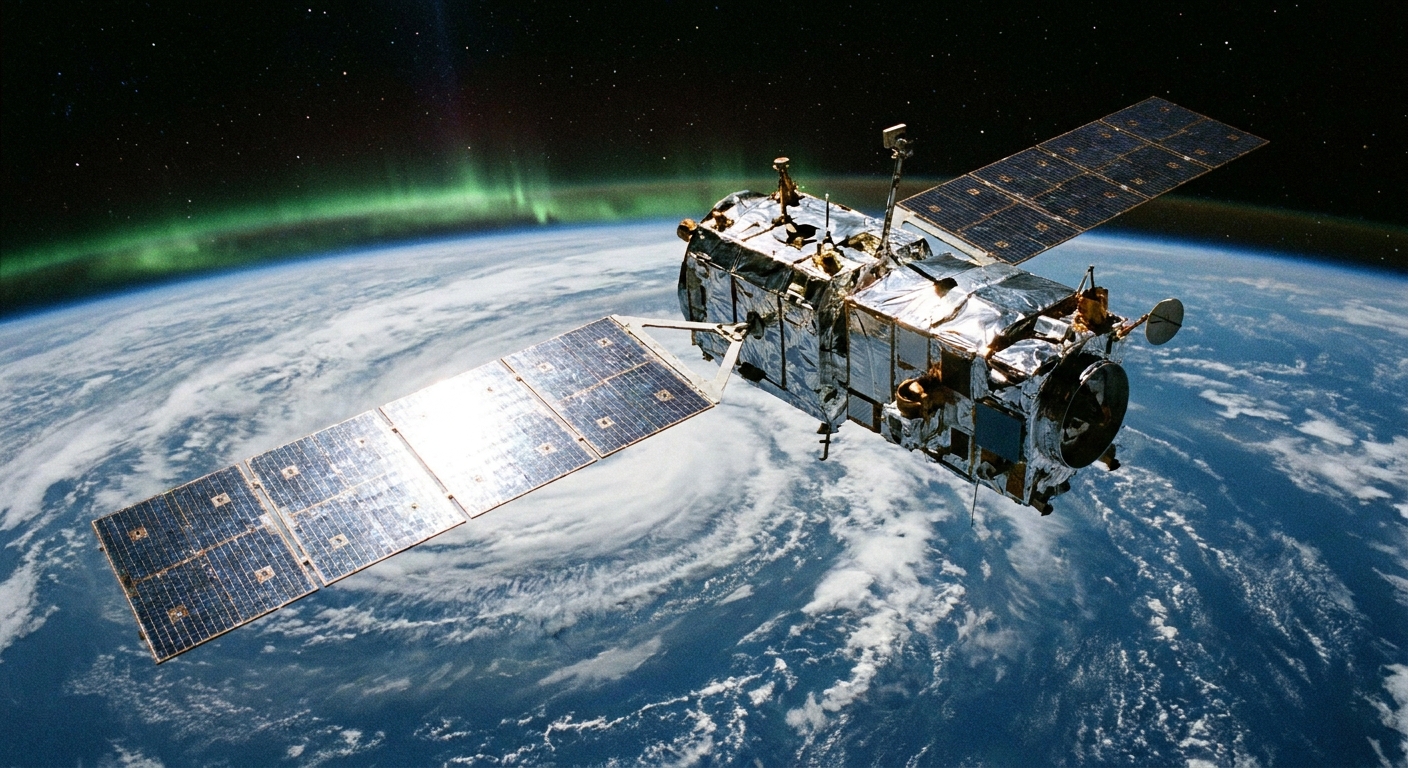
Visible light: the classic view of clouds
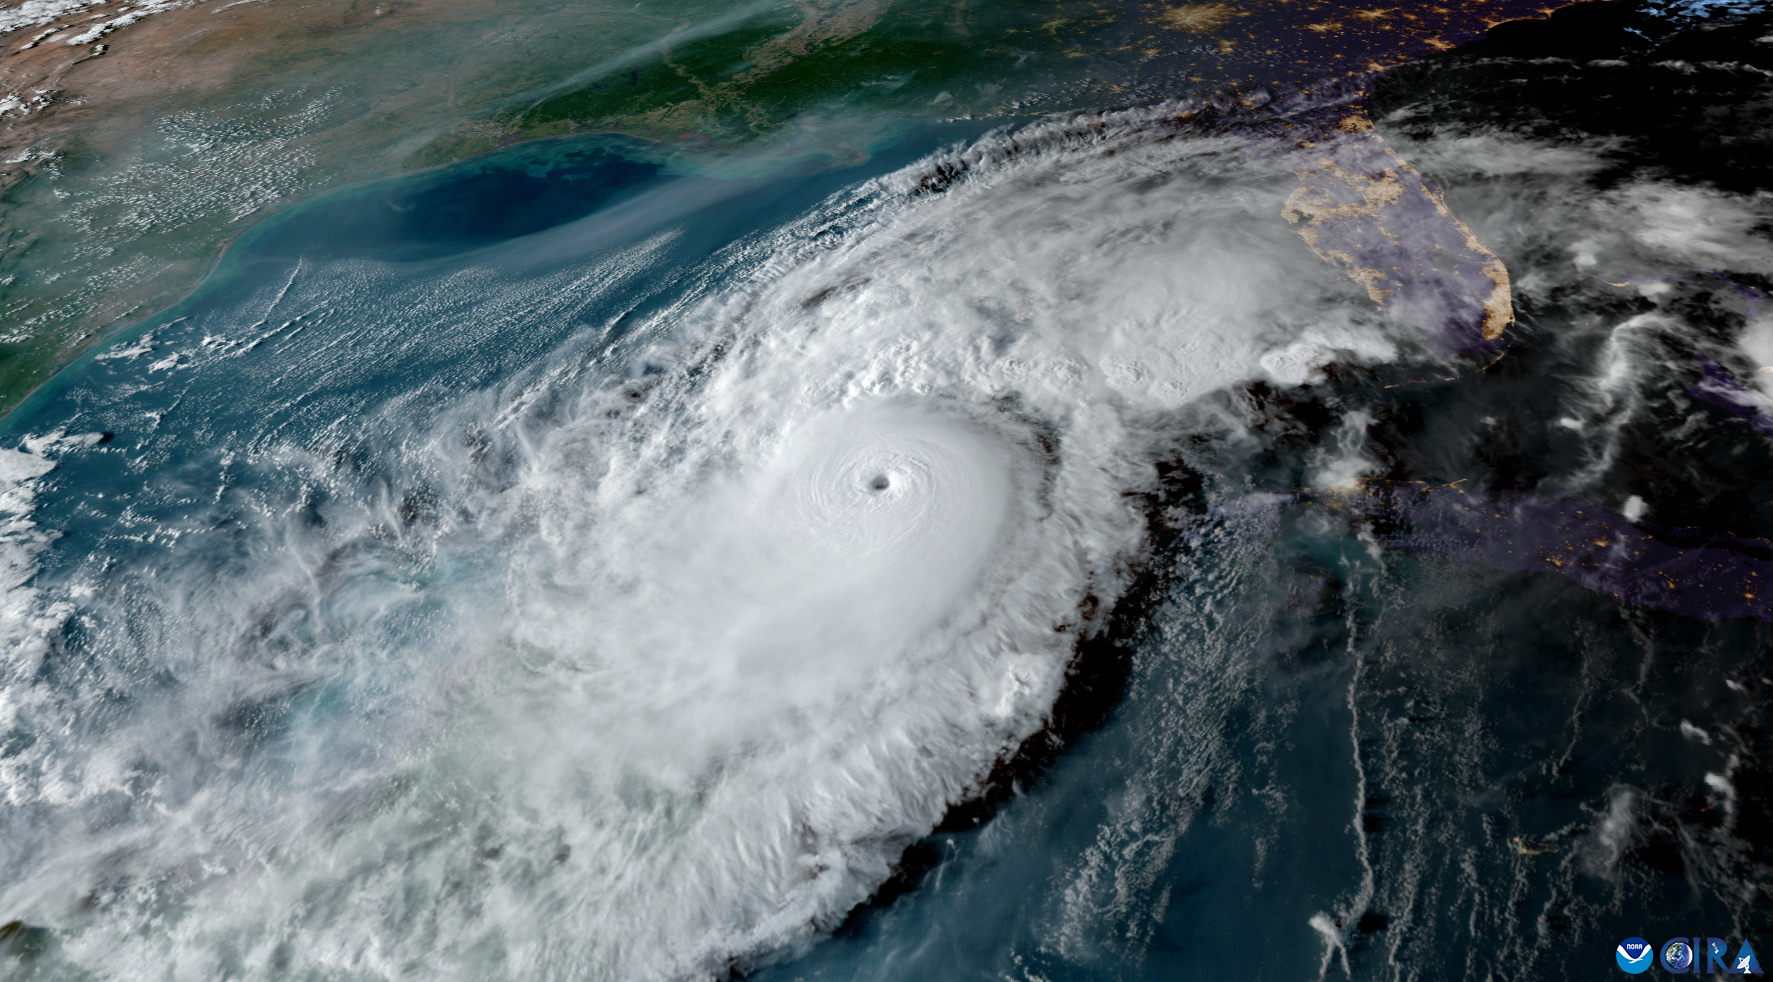
Visible satellite imagery is literally sunlight reflected off Earth and its clouds, captured by a sensor tuned to wavelengths our eyes can see. In daytime, it gives the most intuitive view of a storm’s structure: spiraling bands, bubbling thunderstorm tops, and the textured difference between thin cirrus and thick cumulonimbus.
What visible imagery is great for
- Cloud shape and texture: You can often spot overshooting tops, outflow boundaries, and sharp edges where storms are ventilating strongly aloft.
- Low clouds and fog: In the right conditions, visible detail can reveal fog banks and marine stratus patterns.
- Storm “personality”: Organization cues like banding symmetry, eye definition, and how cleanly an anvil spreads out can hint at intensification or weakening.
Its big limitation: it needs sunlight
At night, visible channels go dark. That is when infrared becomes the workhorse.
Infrared: cloud-top temperature and storm depth
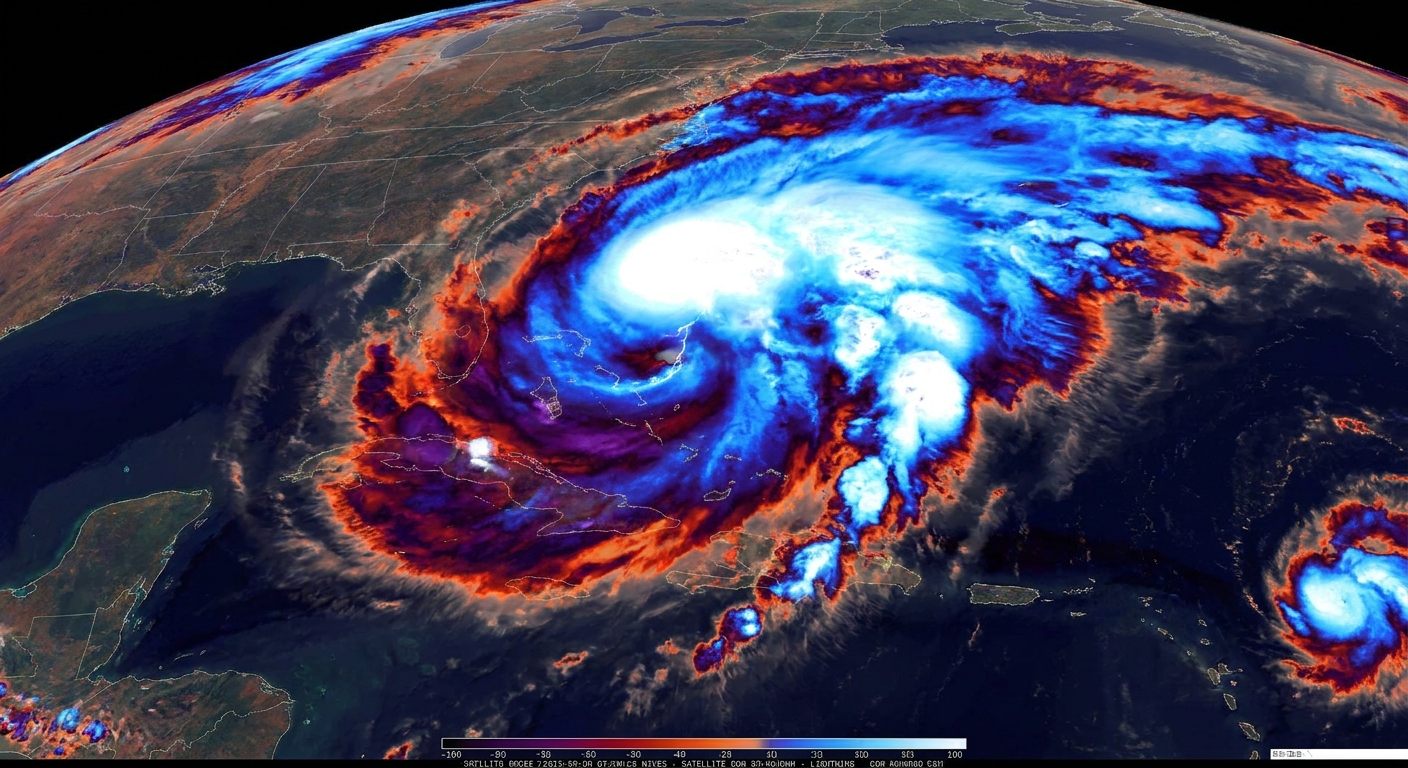
Infrared, often shortened to IR, does not rely on reflected sunlight. It detects thermal radiation emitted by Earth, clouds, and the atmosphere. In simple terms, the sensor is mapping temperature.
Why does temperature tell you about storms? Because the atmosphere generally gets colder with altitude in the troposphere. Tall thunderstorm towers punch upward into colder air, so their tops register as very cold in IR imagery.
What IR imagery is great for
- Nighttime storm tracking: IR works 24/7.
- Identifying deep convection: Very cold cloud tops often signal strong updrafts and potentially severe thunderstorms.
- Estimating cloud-top height: Colder usually means higher, which is often a clue to storm vigor.
- Watching rapid intensification signatures: For tropical cyclones, changes in the symmetry and coldness of cloud tops can be meaningful when paired with other data.
A subtle but important caution
IR is mainly telling you about the top of the cloud deck. A storm can have extremely cold tops while producing limited rain at the surface in some situations, and a warm-topped rain system can still dump a lot of water. That is where microwave sensors can add real value.
Microwave: precipitation and structure inside storms
Microwave remote sensing is the closest thing satellites have to storm X-ray vision, with an important asterisk. Some microwave frequencies can penetrate many cloud layers that block visible and IR views, and they interact more directly with raindrops, snowflakes, and ice particles. But microwave “see-through” ability depends on frequency and the storm itself. Heavy rain can absorb and scatter microwaves, and higher-frequency channels are especially sensitive to ice scattering.
Depending on the exact instrument, satellites may measure microwaves that are naturally emitted from Earth and the atmosphere (passive microwave) or, less commonly for spaceborne weather work, send out pulses and listen for a return signal (active radar on certain research and precipitation missions). Either way, what you are really looking at is a pattern of microwave brightness temperatures shaped by emission and scattering, not a camera-like view of cloud tops.
What microwave observations are great for
- Rain under the cloud shield: In a tropical cyclone with a thick canopy, microwave data can reveal where the heaviest rainbands actually are.
- Storm anatomy: You can often see features like eyewalls, inner rainbands, and dry slots more clearly than in IR.
- Ice scattering signatures: Strong convection lofts ice high into storms. That ice can leave distinctive microwave fingerprints tied to intense updrafts.
- Better precipitation estimates over oceans: With fewer ground sensors at sea, microwave helps fill crucial gaps.
Tradeoffs: not constant, not as intuitive
Microwave instruments are frequently carried on polar-orbiting satellites, which means you get passes rather than continuous video. And the imagery can look less intuitive than a visible cloud view, because it is mapping microwave brightness temperatures and scattering effects, not a simple picture of cloud tops.
Water vapor: the airflow between storms
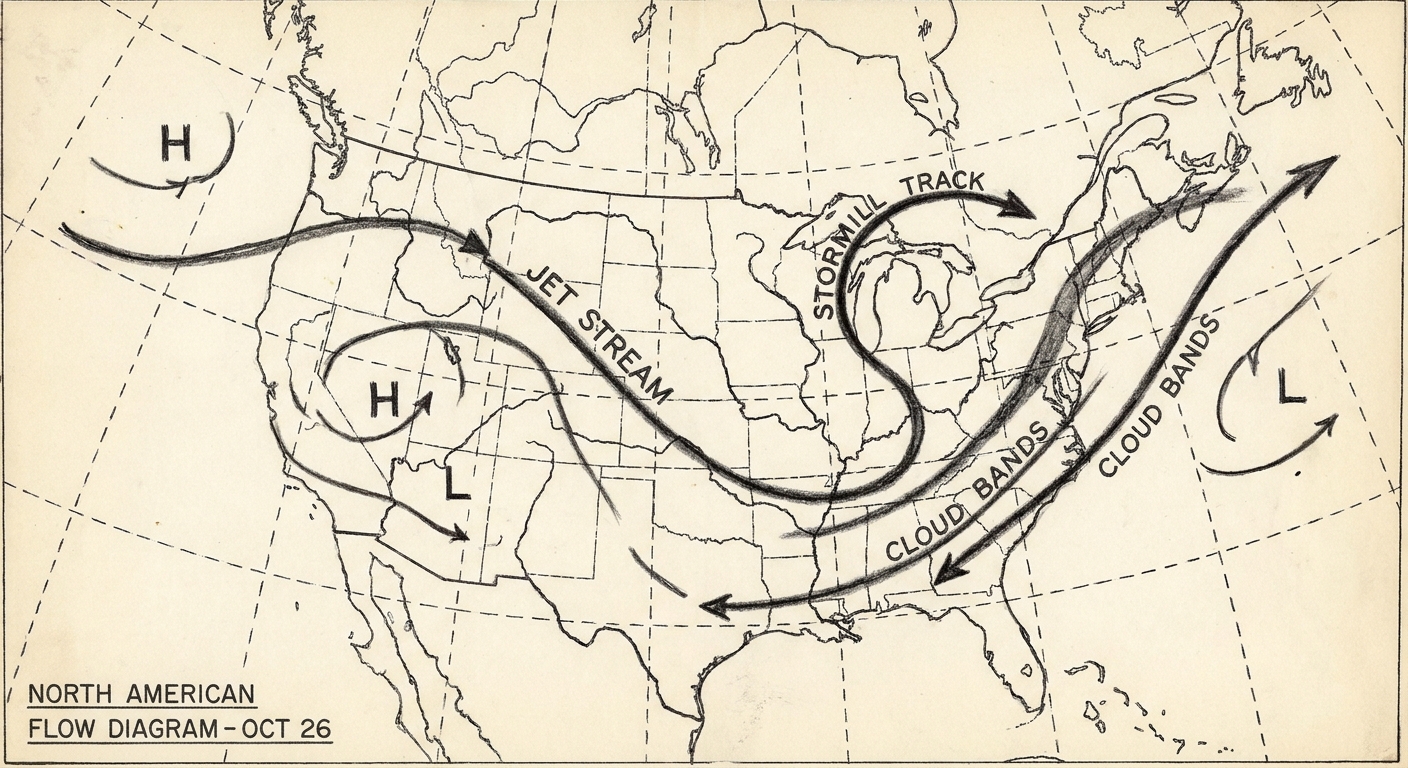
One channel set that deserves a quick mention is water vapor imagery. It is not showing “humidity at the surface.” It is highlighting moisture patterns mostly in the mid and upper atmosphere. Forecasters use it to spot dry slots, jet stream dynamics, and the broad steering patterns that help storms organize and move.
How satellites turn measurements into storm products
A raw satellite measurement is a number: how much radiation arrived at the detector in a given wavelength band. The storm products you see in apps and forecasts are built from layers of physics and calibration.
Cloud motion: tracking patterns frame to frame
Geostationary satellites are especially good at this. By following how cloud features move between images, computers estimate wind speed and direction at different heights. Those heights are themselves estimated from the tracked feature’s temperature and texture, so there is uncertainty, especially when the algorithm is tracking a semi-transparent layer or a feature that is not a true “cloud top.” Meteorologists still use these atmospheric motion vectors heavily because, taken together, they add up to a useful picture of the flow that steers and shapes storms.
Cloud-top cooling: a clue for storm growth
If the top of a thunderstorm rapidly cools in IR imagery, that often means the cloud top is rising into colder air, a sign of a strengthening updraft. It is not a guarantee of severe weather, but it is a useful early hint.
Precipitation estimates: blending microwave, IR, and models
Satellites do not measure “rain rate” directly the way a rain gauge does. Instead, algorithms infer precipitation from microwave signatures (most directly tied to hydrometeors) and sometimes extend that information using geostationary IR patterns between microwave overpasses. Many modern precipitation products also incorporate numerical weather models for consistency.
How to read satellite loops without fooling yourself
A common misconception is that the brightest colors in an IR enhancement mean the heaviest rain. Often they mean the coldest cloud tops, which can correlate with intense convection, but do not automatically translate to rainfall at the ground. If you want “where is the rain,” look for microwave-based products, radar (when available), and official precipitation analyses that blend multiple sources.
Where ground radar fits in
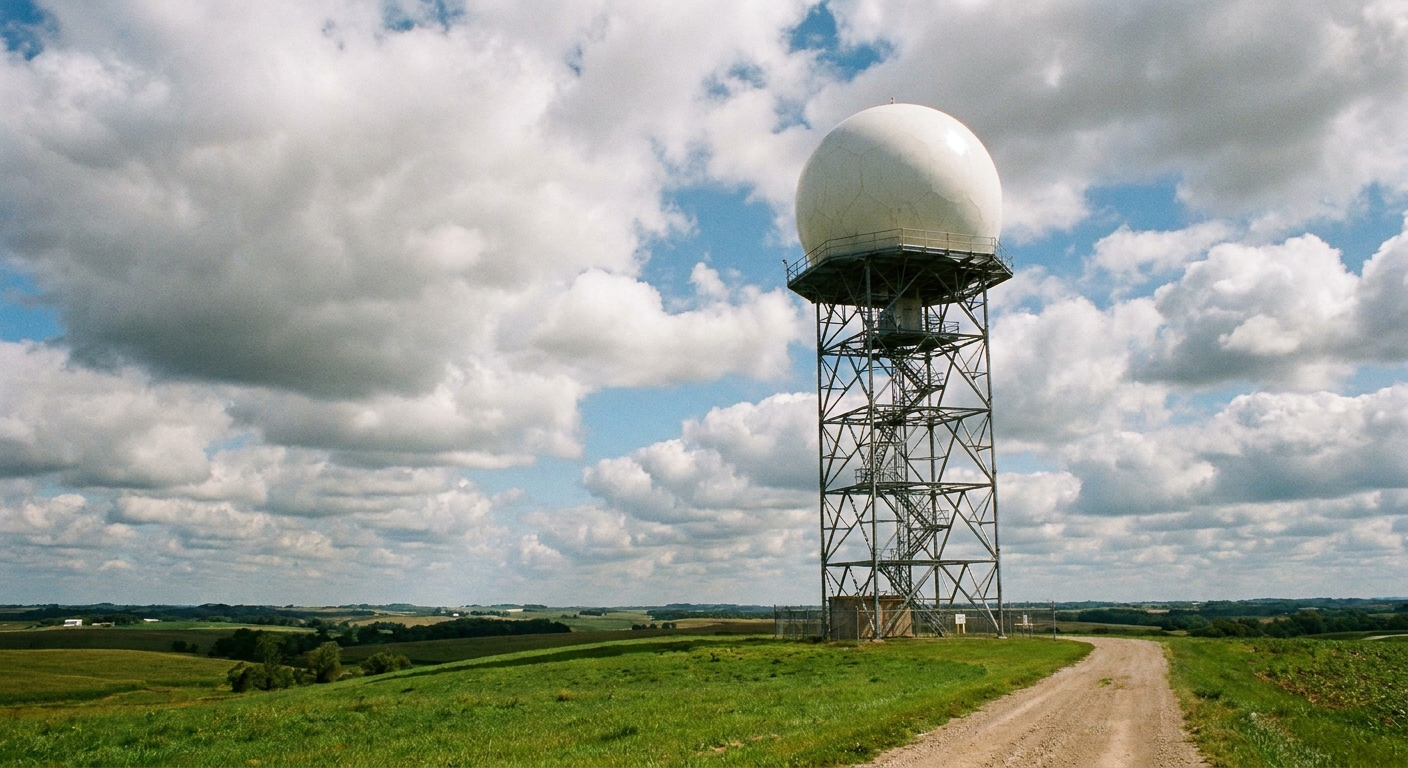
If satellites are the wide-angle lens, ground radar is the close-up zoom on what is happening inside storms near you. Doppler weather radar actively sends out radio pulses and measures what bounces back from raindrops, hail, and other particles. That lets it estimate precipitation intensity and motion, and it measures winds along the radar beam (radial velocity). From that, meteorologists can infer rotation signatures and other wind patterns within storms.
- Radar is best for: local detail, rotation signatures, and near-real-time precipitation structure within range of the radar.
- Satellites are best for: global coverage, ocean storms, cloud-top evolution, and continuous monitoring from space, especially where radar coverage is sparse or nonexistent.
Forecasters lean on both because they answer different questions. A satellite can tell you a storm is building a towering cold top offshore. Radar can tell you whether that storm is producing hail and how fast it is moving toward town.
Putting it together: three views of the same storm
If you remember nothing else, remember this trio:
- Visible: What the cloud field looks like in sunlight. Great for structure and motion in the daytime.
- IR: How cold the cloud tops are, day or night. Great for storm height and convective intensity clues.
- Microwave: What is happening deeper in the storm, including precipitation patterns. Great for peeking beneath the cloud canopy, with frequency and storm-dependent limits.
It is like watching a play with different stage lighting. The actors are the same storm clouds, but each lighting color reveals different details. And when you combine the views, storms stop being mysterious swirls and start becoming understandable systems that obey physics, beautifully and stubbornly, every time.
FAQ
Can satellites detect tornadoes directly?
Not in the way radar can detect rotation signatures close to the ground. Satellites can spot ingredients and storm-top signals associated with severe storms, like rapidly cooling cloud tops, overshooting tops, and expanding anvils. But a tornado is small and short-lived compared with a satellite pixel, so confirmation and warnings rely heavily on radar and ground reports.
Why do some satellite views show storms in strange colors?
Many popular satellite views are “false color” enhancements. The colors represent temperature ranges (IR) or a combination of channels chosen to highlight features like high thin cirrus versus thick convective clouds. The goal is not artistic flair, but contrast: helping meteorologists see patterns quickly.
Does a colder cloud top always mean a more dangerous storm?
Colder tops often correlate with stronger updrafts, but it is not a guarantee of severe weather at the surface. Storm hazards depend on many factors, including wind shear, moisture, instability, and what the storm is doing below the top. Think of IR as a powerful clue, not a verdict.
How often do geostationary satellites update?
It depends on the satellite system and mode, but modern geostationary imagers often update full-disk views every 5 to 15 minutes, and can scan smaller regions more frequently. That rapid refresh is why you so often see smooth storm loops in forecasts.