A smart weather station is a practical weekend project that gives you hyperlocal readings you can trust, and a fun excuse to learn a bit about sensors, calibration, and dashboards. This guide walks through a solid, buildable setup that measures temperature, humidity, pressure, and optional outdoor conditions like rainfall and wind. You can keep it simple for indoor monitoring or expand it into a full backyard station with a web dashboard.
What you will build
- Core readings: temperature, humidity, and barometric pressure
- Optional add-ons: outdoor temperature, rainfall, wind speed and direction, air quality
- Data storage: local logging to a database or cloud service
- Dashboard: phone-friendly charts and alerts
Parts list
Pick one controller path and one sensor set. The components below are common, inexpensive, and well supported.
Controller options
- ESP32: built-in Wi-Fi, great for an always-on sensor node. It can be truly low-power if you choose a low-quiescent-current board and use deep sleep between readings.
- Raspberry Pi: easier for running a full dashboard locally, uses more power
Core sensors
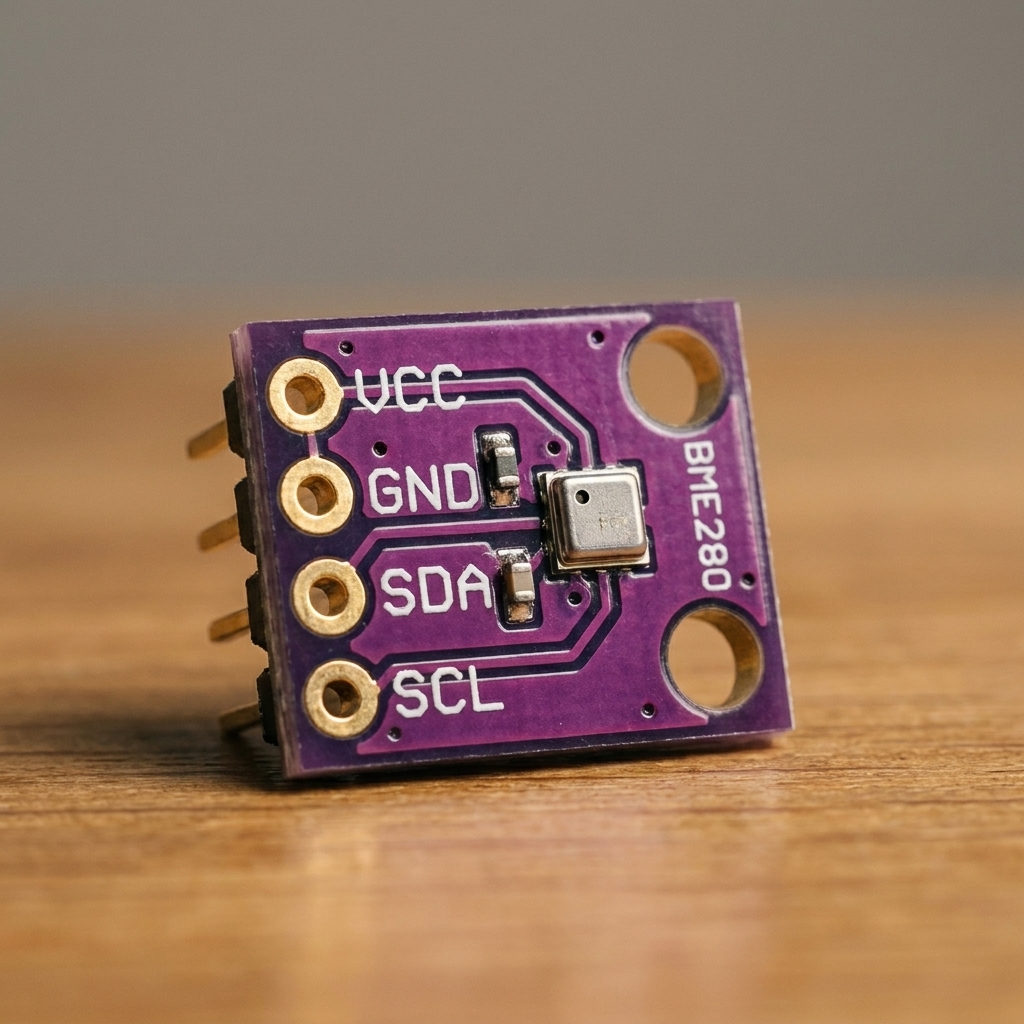
- BME280: temperature, humidity, pressure (I2C). Widely used and reliable.
- Alternatives: SHT31 (temperature and humidity), BMP280 (pressure only)
Optional outdoor sensors
- DS18B20 probe: outdoor temperature in a waterproof form factor
- Tipping-bucket rain gauge: rainfall totals based on switch pulses
- Anemometer and wind vane: wind speed via pulses; many hobby wind vanes encode direction with a resistor ladder
- PMS5003 or SPS30: particulate air quality. These typically report PM1.0, PM2.5, and PM10 (exact outputs depend on model and library).
Power and enclosure
- USB power supply (5V) for always-on indoor or sheltered installs
- Outdoor-rated enclosure with cable glands
- Optional: buck converter and solar plus battery if you want an off-grid node
Design choices
Before you solder anything, decide where the station will live and what matters most.
- Indoor vs outdoor: Outdoor needs weatherproofing and better placement to avoid heat bias.
- Single box vs split sensors: Pressure sensors prefer being sheltered. Rain and wind sensors must be exposed.
- Local only vs cloud: Local is private and robust. Cloud makes remote access and sharing easier.
Example builds
If you want a clear starting point, here are two proven reference setups. Build one as-written, then iterate.
Build A: ESP32 sensor node
- Parts: ESP32 board, BME280 breakout, optional DS18B20, optional rain gauge and anemometer, 5V USB supply
- Data flow: read sensors → apply offsets → timestamp (NTP) → publish via MQTT or HTTP → (optional) deep sleep
Build B: Raspberry Pi local dashboard
- Parts: Raspberry Pi, BME280 breakout, microSD, power supply
- Data flow: read sensors in Python → write to InfluxDB or SQLite → chart in Grafana
Wiring overview
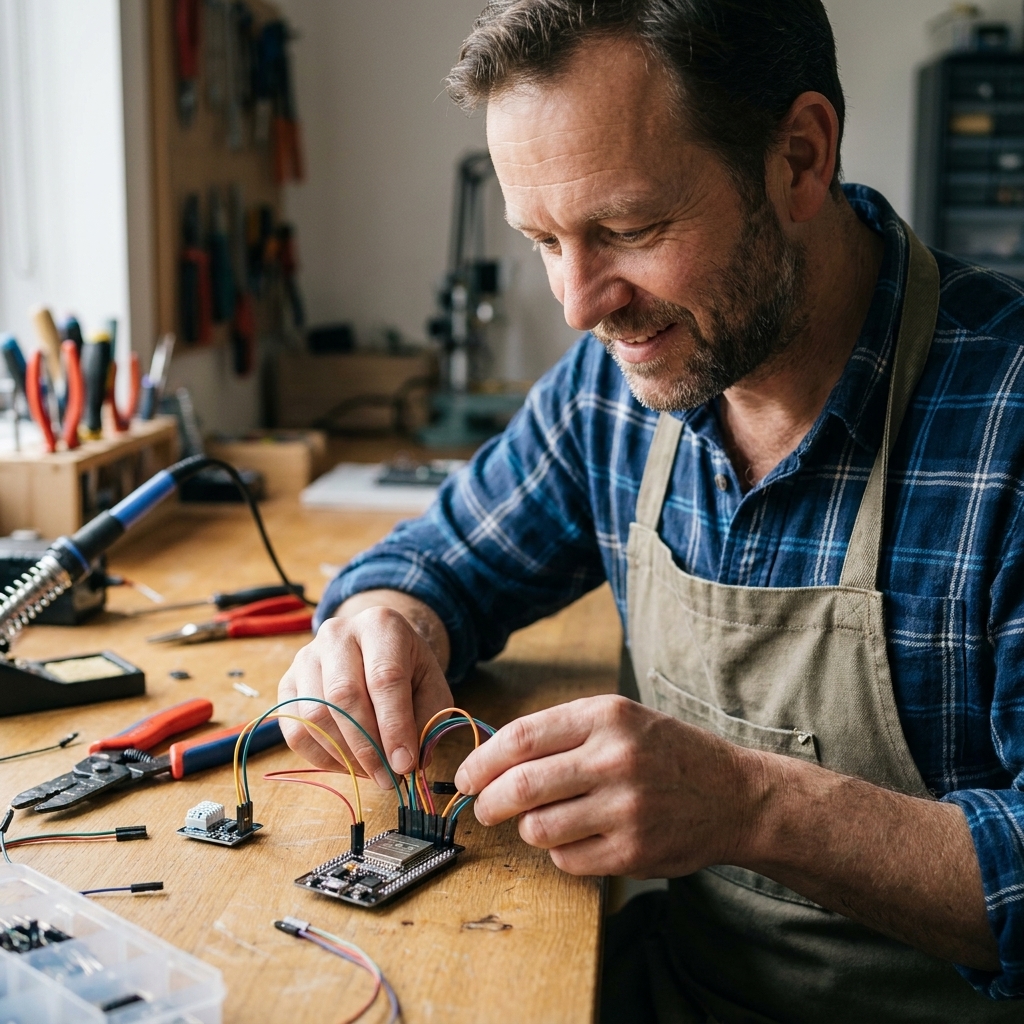
If you use an ESP32 and a BME280 over I2C, wiring is straightforward:
- VCC: 3.3V is the safe default because the BME280 sensor itself is a 3.3V device. Some breakouts include a regulator and level shifting and may accept 5V, so check your specific board.
- GND: ground
- SDA: ESP32 SDA pin (often GPIO 21)
- SCL: ESP32 SCL pin (often GPIO 22)
For pulse-based sensors like anemometers or rain gauges, you typically wire the reed switch output to a GPIO input with a pull-up resistor enabled, then count pulses with an interrupt. Add debouncing (software or hardware), since mechanical reed switches can chatter and create extra counts.
If you are running long outdoor cables, add basic protection: route cables with drip loops, use strain relief, and consider a small series resistor and TVS diode near the controller to reduce ESD spikes. If you live in a lightning-prone area, treat any wired outdoor sensor as a risk and plan accordingly.
Firmware and data flow
A clean approach is: read sensors, apply calibration offsets, publish data, then sleep or wait for the next interval. Pick a sane interval (for example, 30 to 60 seconds for temperature and humidity, faster only if you need gust tracking), and decide what happens when Wi-Fi drops. Even a small buffer (keep the last N readings and retry) makes dashboards much more reliable.
ESP32 approach
- Use Arduino IDE or PlatformIO
- Read BME280 via a library (Adafruit or similar)
- Send readings via MQTT or HTTP
- Optional: deep sleep to reduce power (and choose a board designed for low standby current if battery-powered)
Raspberry Pi approach
- Read sensors in Python
- Store to InfluxDB or SQLite
- Visualize with Grafana or a lightweight web app
Calibration and accuracy
Consumer-grade sensors can be excellent if you treat them right. The biggest errors come from placement and airflow, not the chip itself.
- Temperature: Keep the sensor shaded and ventilated. Direct sun and warm walls will skew readings.
- Humidity: Avoid mounting inside a sealed box. Humidity needs exposure to ambient air.
- Pressure: Decide whether you are displaying station pressure (raw pressure at your elevation) or sea-level pressure (corrected to sea level for easier comparison). Many dashboards can apply a sea-level correction if you provide altitude. If you compare against an official station, make sure you are comparing the same kind of pressure, then apply an offset only if needed.
Outdoor placement basics
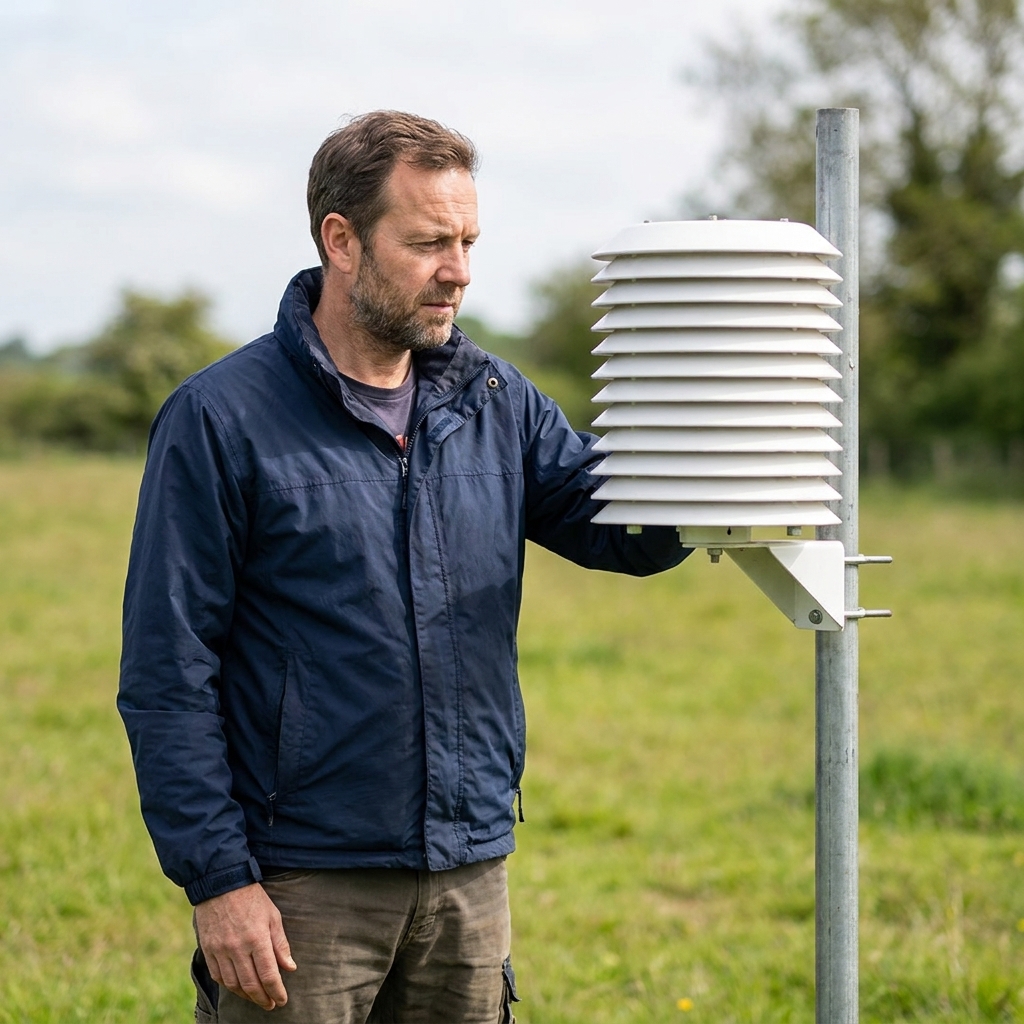
- Temperature and humidity: Use a radiation shield or ventilated enclosure, mounted over grass if possible.
- Rain gauge: Level it carefully, away from roof drip lines and obstructions.
- Wind: Higher is better, ideally above nearby rooftops. If that is not possible, document the height and obstructions.
For outdoor enclosures, plan for condensation. Use vents or a breathable membrane vent, avoid trapping warm moist air, and keep sensor openings protected from direct splash. Cable glands plus drip loops help keep water from wicking into the box.
Dashboard ideas
You do not need anything fancy to make the station feel alive. Start with a few charts and a couple of alerts.
- Charts: temperature and humidity over 24 hours, pressure trend, rainfall totals per day
- Alerts: freeze warning, high humidity, rapid pressure drop
- Sharing: export CSV, publish a public page, or integrate with Home Assistant
Troubleshooting
- Readings look too hot: sensor is getting radiant heat from sun or enclosure. Add shade and airflow.
- Humidity stuck high: trapped air or condensation. Improve ventilation and check for water ingress.
- Wi-Fi drops: move the node, add a better antenna, publish less frequently, or buffer readings during outages.
- Pressure seems off: confirm whether you are looking at station pressure or sea-level pressure, then apply the correct correction or offset.
Next upgrades
- Add a particulate sensor for air quality tracking
- Use LoRa to link an outdoor node to an indoor gateway
- Log multiple locations for microclimates around your property
- Build a simple forecast indicator from pressure trend and humidity
If you keep the first version small and dependable, you will actually use it. Then you can iterate: better placement, cleaner enclosure, extra sensors, and a dashboard that tells you something meaningful about your own patch of sky.