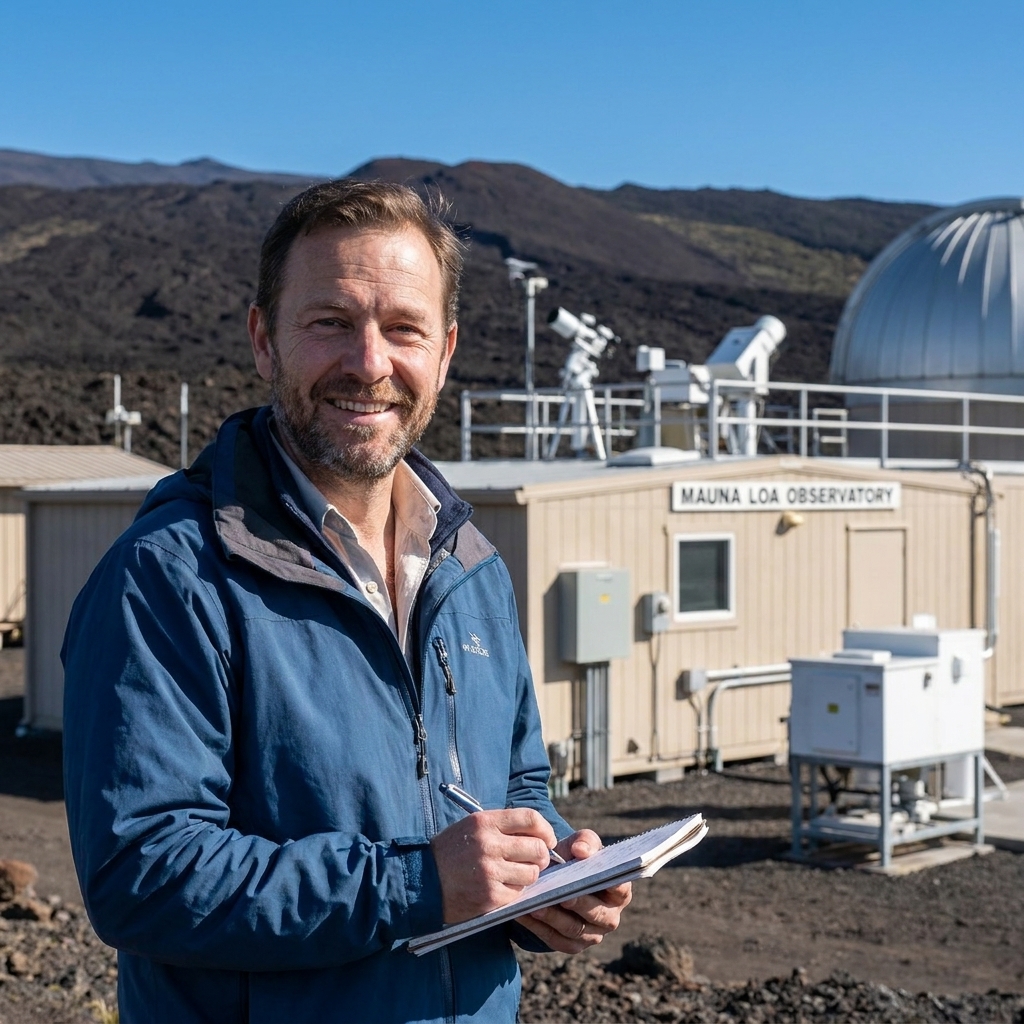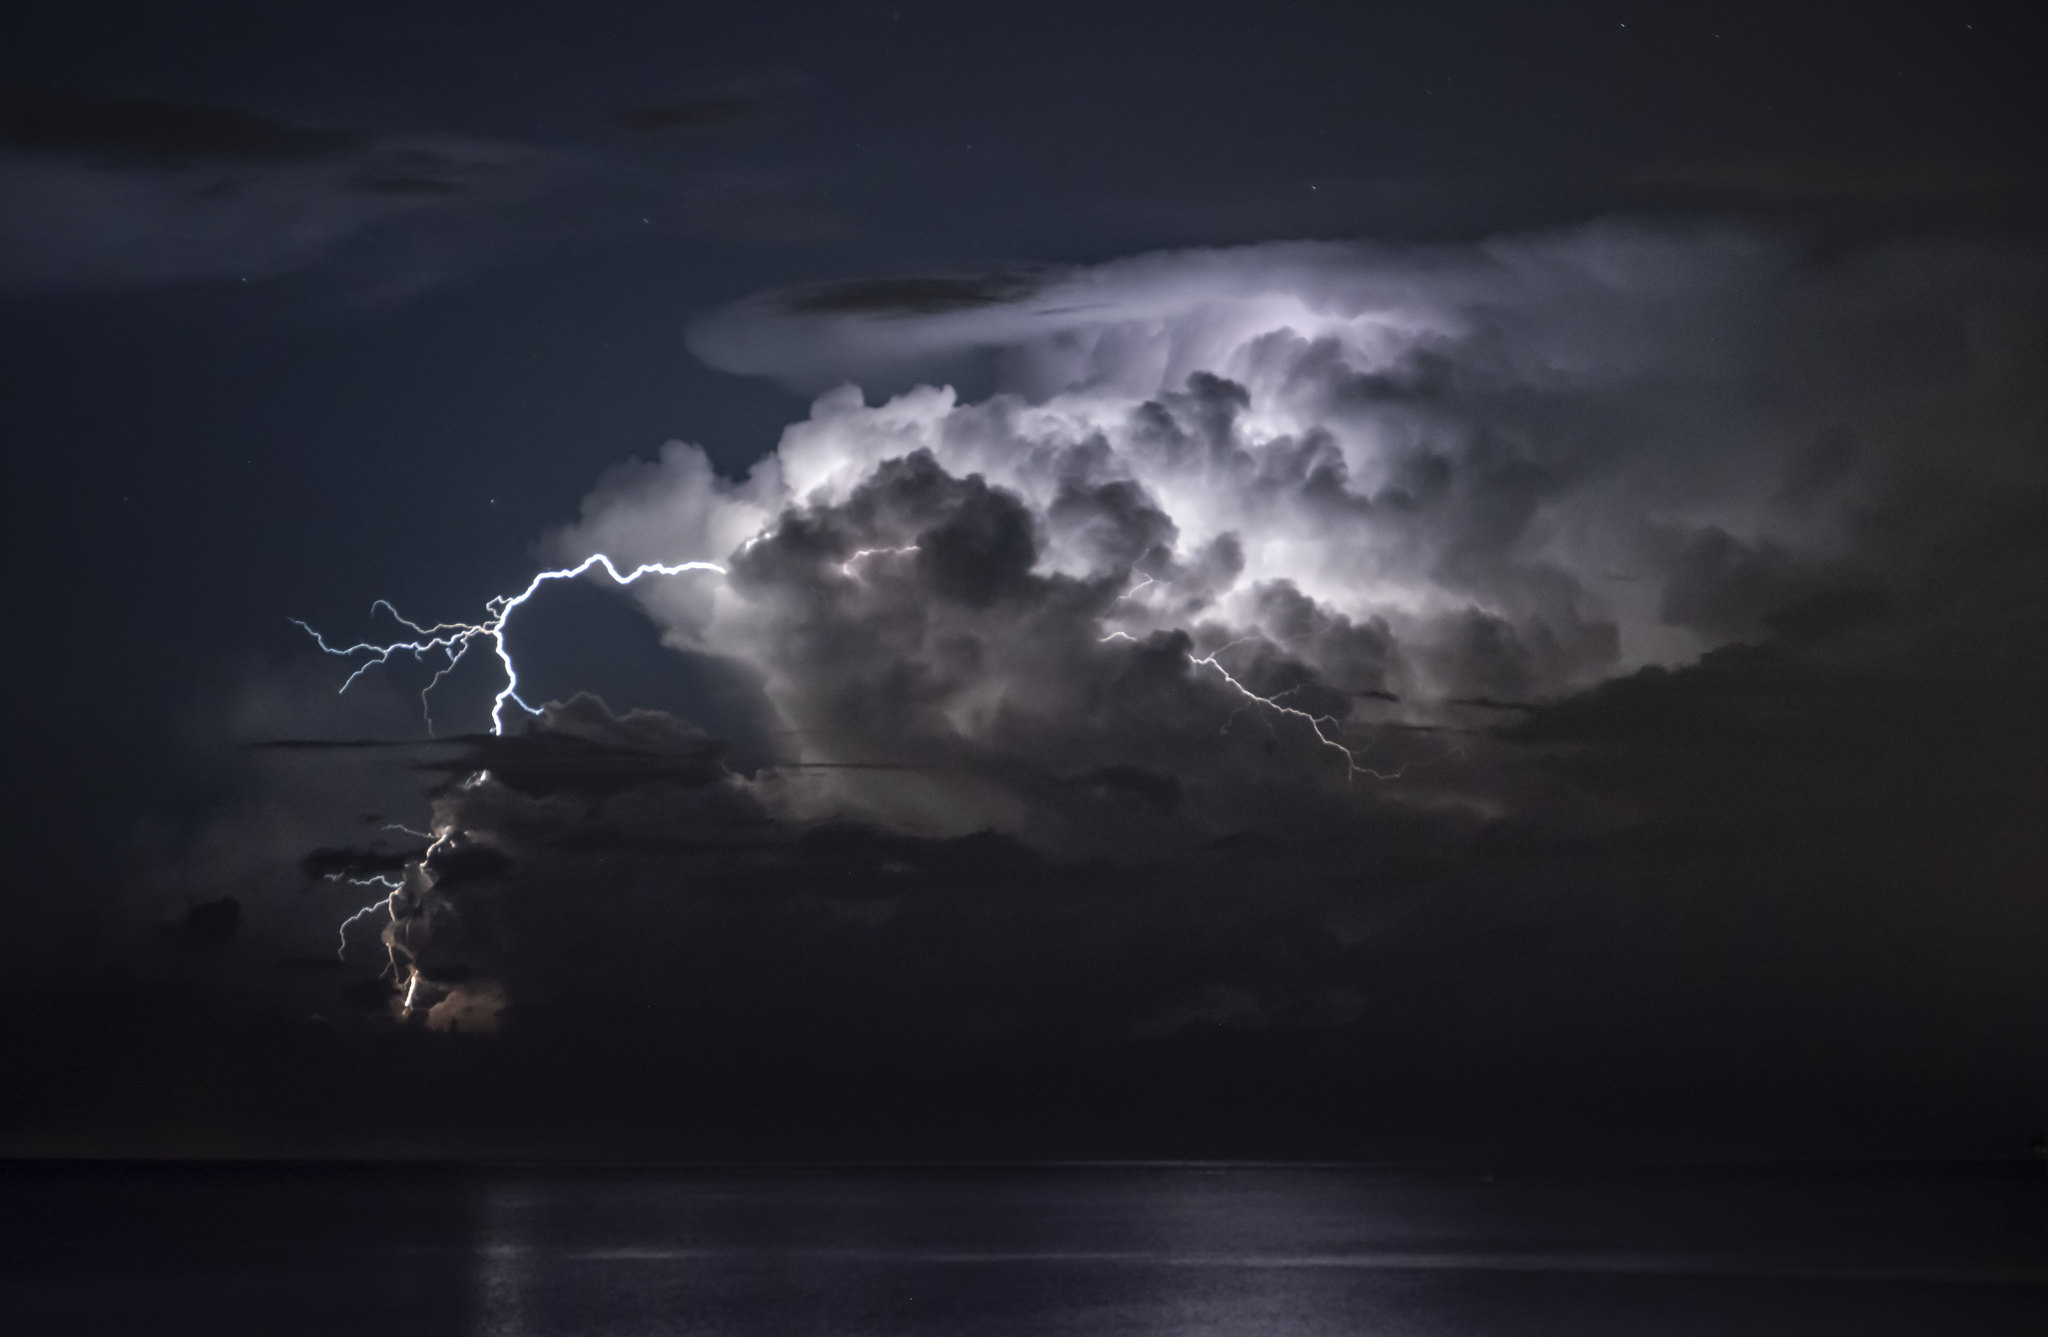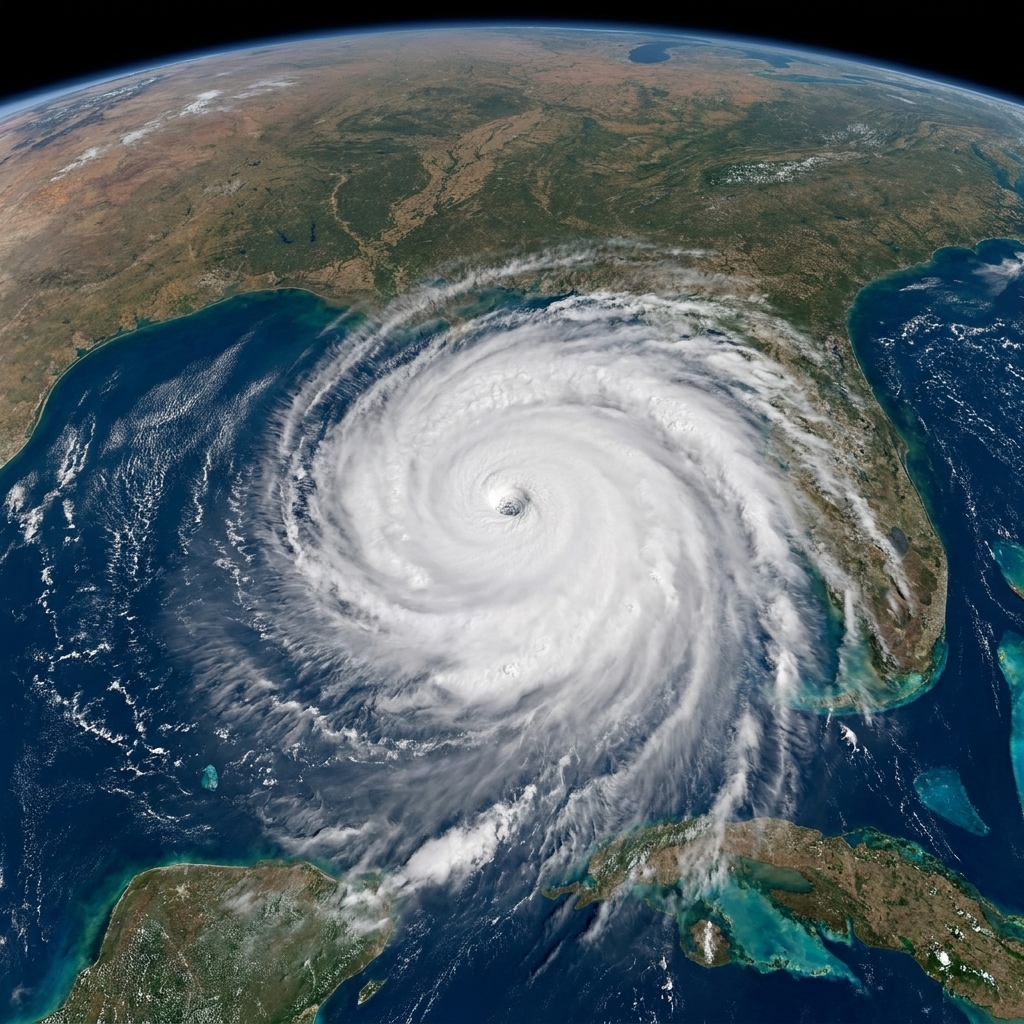
I used to tell my physics students that the hardest part of science is not doing the math. It is asking the question in a way nature can actually answer. That lesson shows up in a big way after a catastrophic heat wave or a record-shattering flood, when the obvious question hits: was this climate change?
Scientists do not answer that by pointing at one thermometer reading and declaring guilt. They use a branch of climate science called extreme-event attribution. It is essentially a controlled experiment run inside computers: compare the world we live in to a near-twin world without the human-caused warming influence, and see how the odds or intensity of a specific event change.
What attribution means
Attribution studies focus on one clearly defined event, such as a particular heat wave in a certain region over a set date range, and ask a very specific question:
- How did human-caused warming change the likelihood of an event like this happening?
- Or how did it change the intensity of the event that did happen?
Notice what is missing: “Did climate change cause this disaster?” Real-world disasters involve hazards plus exposure and vulnerability. A storm is meteorology. A disaster is also infrastructure, land use, building codes, emergency response, and who lives where.
So scientists usually attribute the meteorological event (the rainfall amount, the heat index, the drought severity), not every downstream impact (the flooded homes, the crop losses, the fatalities).
Two worlds, same dice
Here is the core metaphor I lean on: weather is like rolling dice. Climate is what determines how weighted those dice are and which outcomes become more likely.
Extreme-event attribution asks whether human greenhouse gases have loaded the dice toward certain extremes.
The factual world
This is the world we live in, with today’s greenhouse gas levels, today’s sea surface temperatures, and today’s land use patterns, as best scientists can reconstruct them for the event.
The counterfactual world
This is the near-twin world scientists use as a baseline: one where the anthropogenic forcing is removed or adjusted to represent a climate without human-caused warming. In practice, that usually means changing greenhouse gases, and often also accounting for other human influences such as aerosols and land use. The exact setup varies by research group and by event.
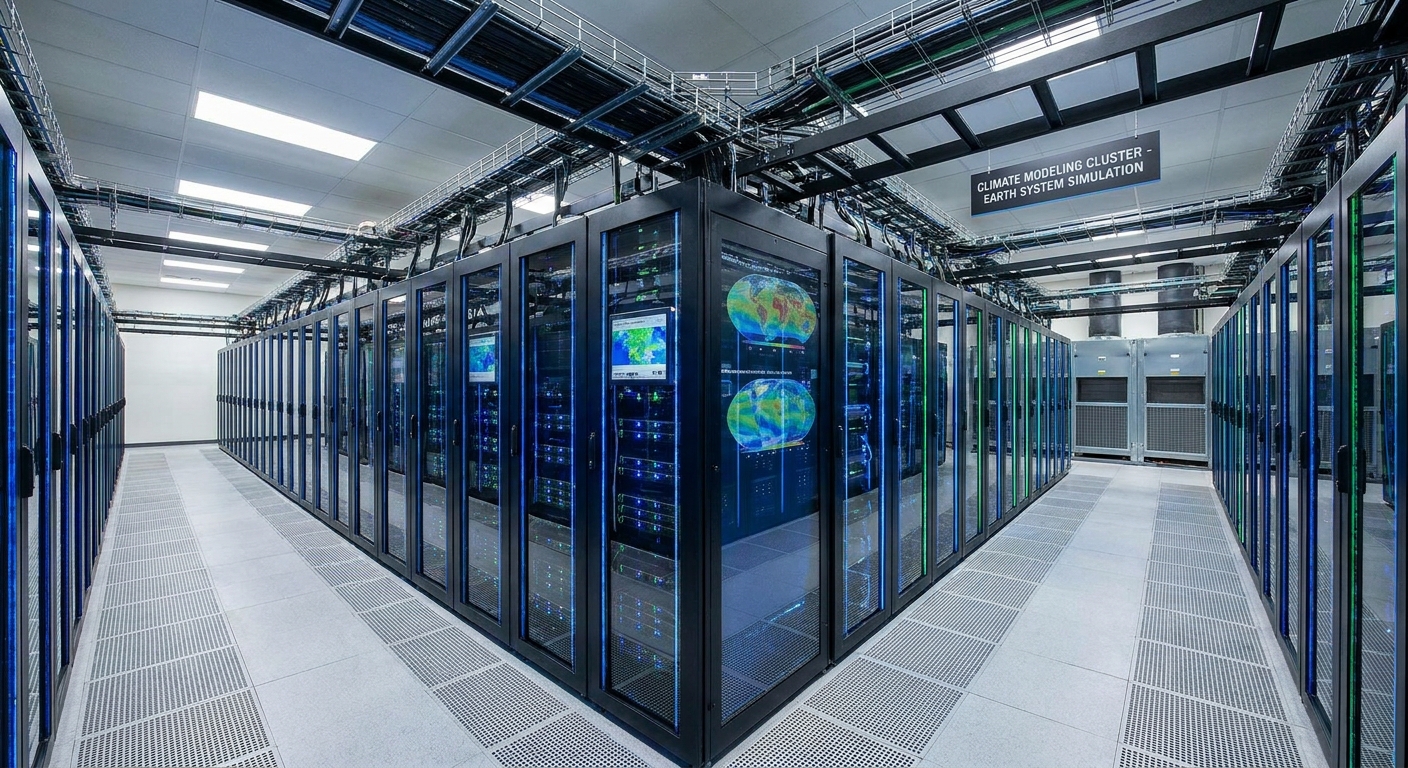
Then they run many simulations in both worlds. Not one or two. Depending on the method and the data available, it can range from dozens to thousands of model years worth of “virtual weather,” because rare events are, by definition, rare.
You will also see different model configurations used for different purposes. Some studies run atmosphere-only models driven by observed sea surface temperatures, which can better reproduce the specific large-scale pattern that occurred. Others use fully coupled ocean-atmosphere models to capture longer-term climate dynamics. Both approaches can be useful, and they answer slightly different slices of the question.
Defining the event
You cannot attribute a fuzzy target. Before any modeling, scientists define an event in measurable terms. Common choices include:
- Heat waves: maximum temperature averaged over several days, nighttime minimums, or heat index over a region.
- Heavy rain and floods: one-day or multi-day rainfall totals in a watershed, or river discharge if the study includes hydrology.
- Droughts: soil moisture anomalies, precipitation deficits, or indices that combine temperature-driven evaporation with rainfall.
Two studies can look at the same news headline and legitimately get different answers if they define the event differently, for example focusing on peak one-day rainfall versus three-day totals, or city temperatures versus a whole region.
How the comparison is built
There are a few standard ways attribution teams build their two worlds. They often use more than one approach to see if results agree.
1) Large model ensembles
Scientists run the same climate model many times with slightly different initial conditions. That produces many plausible weather histories under the same climate background. Do this for both factual and counterfactual conditions, then compare how often the defined event occurs.
2) Multiple models, same question
Instead of one model many times, teams can use many models. Each model represents clouds, storms, and land surface processes a bit differently. Agreement across models boosts confidence, while disagreement highlights uncertainty.
3) Storyline approaches
Sometimes researchers focus on a specific circulation pattern that occurred, like a blocking high-pressure system. They ask: given that pattern, how much hotter did it become because the background climate is warmer? This often yields a cleaner estimate of intensity change rather than probability change.
4) Observations and statistics
It is not “just models.” Researchers also lean on observations to evaluate whether models reproduce the relevant kind of extreme for the region and season. In some studies, they fit statistical models to observed records and model output, using tools from extreme value analysis to estimate how rare an event is and how its probability shifts. Bias correction and model evaluation matter here, because small temperature or rainfall biases can become big deals in the tails of the distribution.
The outputs
Attribution results are usually communicated in one of two ways, and sometimes both.
Change in likelihood
Scientists estimate how often an event like this happens in the factual world versus the counterfactual world.
A common metric is the risk ratio:
- Risk ratio = probability in today’s world ÷ probability in the no-human-warming baseline
If a study reports a risk ratio of 5, that means the event is estimated to be five times more likely in today’s climate than it would have been without human-caused warming.
One quick guardrail I always add when I teach this: “five times more likely” does not automatically mean “likely.” A change from 0.2 percent to 1 percent is a factor of five, and it is still rare in absolute terms.
Change in intensity
Instead of asking “how often,” researchers ask “how strong.” For a heat wave, that might be a change in degrees added to the event. For heavy rainfall, it could be the percent increase in the rain amount for a comparable event.
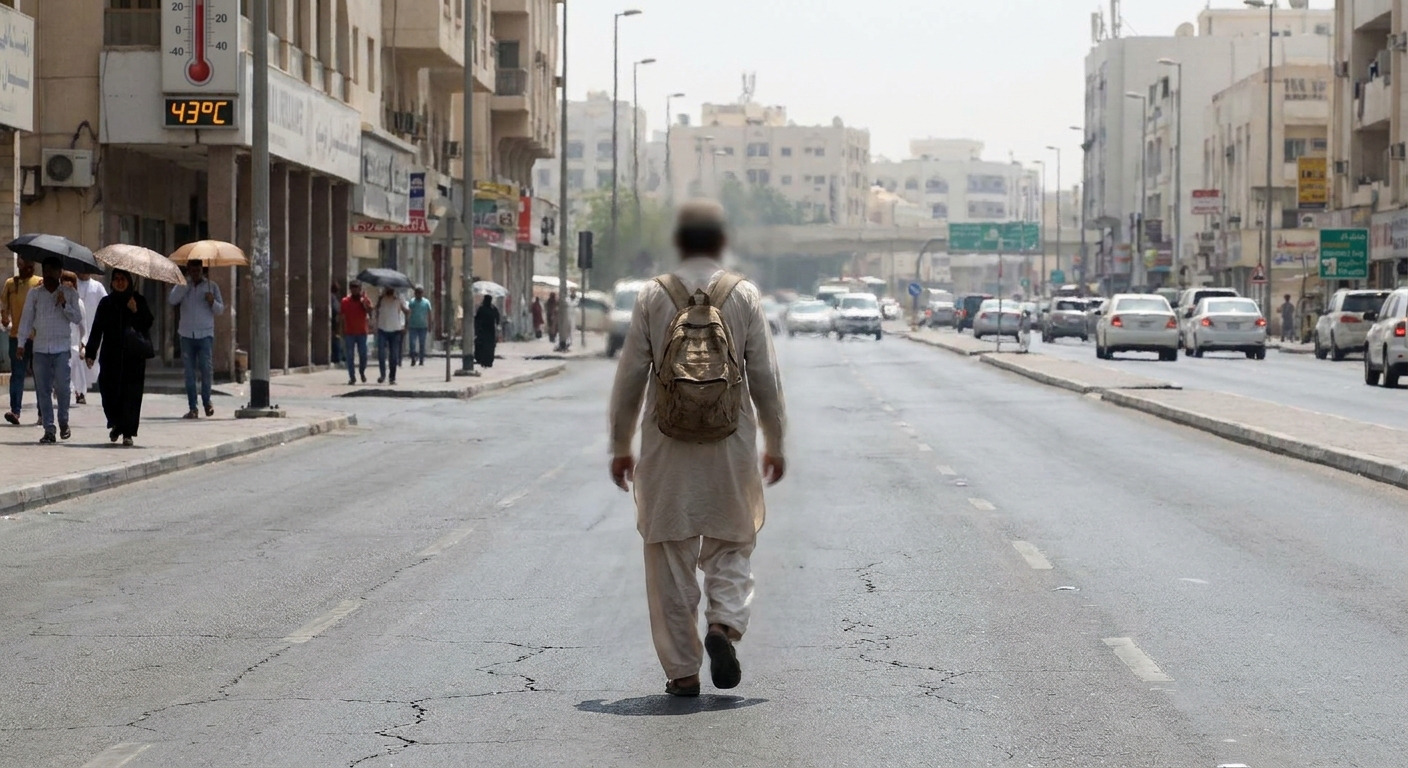
For example, an attribution result might say: a heat wave like this was made about 2°C hotter by human-caused climate change. The exact number is reported with uncertainty ranges.
What a real statement sounds like
In the wild, attribution results are usually phrased something like this: “In our analysis, human-caused climate change made this type of heat wave at least several times more likely, and increased its peak intensity by around 1 to 3°C, with uncertainty depending on the dataset and model set used.” That structure is the point: probability or intensity, plus a range, plus a note about confidence.
Why uncertainty is part of the job
In my classroom days, I would not accept an answer without units. In attribution science, I also do not accept an answer without uncertainty. These studies deal with complex systems and limited observations, so researchers quantify uncertainty from several sources:
- Weather randomness: even in the same climate, the atmosphere can produce a wide range of outcomes.
- Model limitations: models approximate cloud physics, convection, and land surface processes.
- Observational uncertainty: measurements can be sparse, especially for rainfall extremes or in regions with few stations.
- Event definition choices: different thresholds, regions, or time windows can shift results.
- Internal climate variability: patterns like El Niño and La Niña influence extremes on top of long-term warming.
That is why responsible attribution statements sound like: “Human-caused climate change likely increased the probability of this heat wave by a factor of X, with a range of Y to Z.”
What a study can claim
It can usually claim
- Climate change increased or decreased the likelihood of the meteorological event occurring.
- Climate change increased or decreased the intensity of the meteorological event.
- How confident scientists are in the result, based on agreement between models and observations and on model skill for the relevant extreme.
It cannot honestly claim
- That climate change was the only cause of the event. Weather still needs a specific setup.
- That a specific person’s damages were directly caused by greenhouse gases. Impacts also depend on vulnerability and exposure.
- That the event was “impossible” without climate change, unless the data strongly support near-zero probability in the counterfactual world, and even then scientists phrase this carefully.
- That the findings apply unchanged to a different region, season, or type of storm. Attribution is event-specific.
In other words, attribution is not a courtroom drama where the science declares one culprit and rests. It is more like a lab report that quantifies how much the background warming stacked the deck.
Which events are harder
Attribution is often strongest when the event metric is tightly connected to temperature, because the warming signal is clear. Even then, confidence still depends on whether models capture the relevant circulation patterns, how good the observations are, and how the event is defined.
Heat waves
Temperature extremes generally show a strong, direct relationship to global warming, even though circulation patterns often determine when and where the worst heat lands. That combination makes heat waves among the most confidently attributed events.
Heavy rainfall and floods
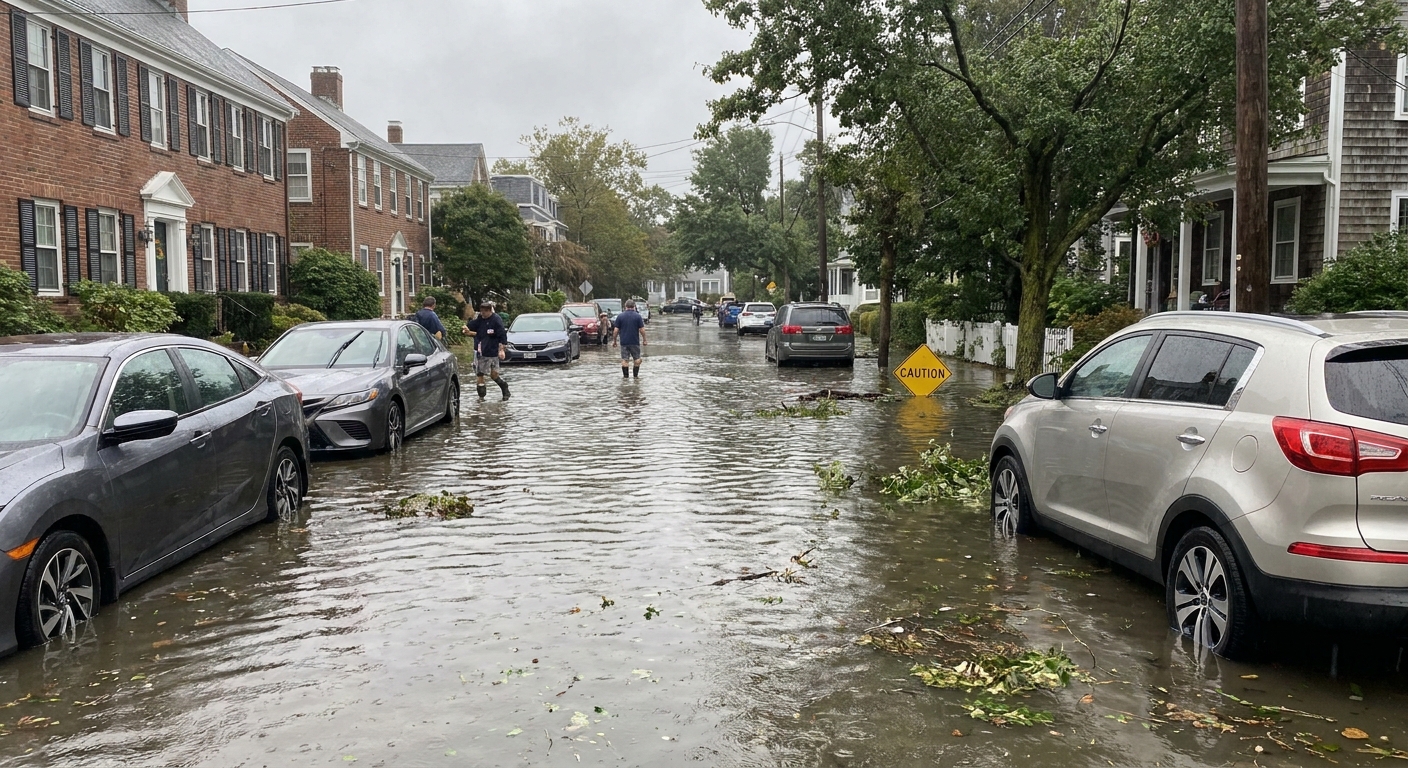
Warmer air can hold more moisture, which can intensify heavy rainfall. But whether that rainfall becomes a damaging flood depends on soil moisture, terrain, drainage systems, reservoir operations, and where the rain falls in the watershed.
Droughts
Drought can mean lack of rain, dried soils, stressed crops, low river flows, or all of the above. Warming increases evaporation demand, which can worsen “hot droughts,” but the exact conclusion depends on which drought definition the study uses.
Wildfires
Climate can set the stage by drying fuels and lengthening fire seasons. But ignition sources, forest management, and wind events heavily shape outcomes. Attribution studies often target metrics like fuel aridity or fire weather indices rather than burned area alone.
Tropical cyclones and hurricanes
Confidence is generally higher for thermodynamic aspects, such as extreme rainfall rates, and in some contexts the probability of rapid intensification. Questions about storm tracks and basin-wide frequency remain tougher because the dynamics are complex and natural variability is large.
Reading headlines
If you take nothing else from this article, take this: attribution is about odds and intensities, not about assigning a single cause.
Here are a few translation tips when you see results in the news:
- “X times more likely” means the probability changed. It does not mean the event was guaranteed, and it does not tell you the absolute probability by itself.
- “Made Y°C hotter” means added intensity to an event that already had a weather setup capable of producing heat.
- Look for the confidence language, such as “likely,” “very likely,” and the uncertainty range.
- Check what was attributed: temperature, rainfall, drought index, or impacts like deaths and damages (impacts are harder).
Good attribution is not a yes-or-no answer. It is a calibrated statement about how much human influence changed the game’s rules.
FAQ
How fast can scientists do an attribution study?
Some teams produce rapid attribution analyses within days to weeks, using established methods and available model ensembles. More comprehensive peer-reviewed studies often take longer, especially if they require high-resolution modeling, detailed impact modeling, or extensive model evaluation.
Do scientists remove climate change from the real world to do this?
No. They remove the estimated human influence in model simulations to create a counterfactual baseline. It is a computational experiment, not a physical one.
If an event is natural, does that mean climate change played no role?
Not necessarily. “Natural variability” describes the atmosphere’s day-to-day chaos and oscillations like El Niño. Climate change can still shift the odds or amplify intensity on top of that variability.
Why do different studies sometimes disagree?
Different event definitions, different models, different time windows, and different treatments of anthropogenic forcings such as greenhouse gases and aerosols can all lead to different results. Disagreement does not automatically mean someone is wrong. It often maps the boundaries of what the evidence can currently support.
Can attribution studies help with preparedness?
Yes. If studies show certain extremes are becoming more likely or more intense, that information can inform building codes, heat action plans, floodplain maps, reservoir management, and insurance risk assessments. The science does not make the policy choice, but it can sharpen the forecast of what “normal” looks like now.
The takeaway
Scientists attribute a single extreme weather event to climate change by doing what scientists always try to do: build a fair comparison. They use models, observations, and statistics to compare a world with today’s human influence to a baseline world without human-caused warming, then ask how the odds or intensity of the defined event changes between them.
A careful attribution study can tell you whether climate change loaded the dice, and by how much. It cannot, by itself, explain every detail of a disaster, or replace the hard work of reducing vulnerability. But it does give us something precious in the aftermath of chaos: a quantitative answer, with uncertainty attached, to a question people genuinely need to ask.