The phrase “global average temperature” sounds like it should come from one giant thermometer hanging somewhere in space. If you have ever tried to get a reliable temperature reading from your own house, you already know the catch: shade matters, pavement matters, wind matters, and your back porch is not the same as the park down the street.
Now scale that problem up to an entire planet with deserts, forests, mountaintops, sea ice, and oceans that cover about 71 percent of Earth. The “global average” is not a single measurement. It is a carefully built statistical summary that combines many different observations into one time series that can track long-term change.
What it means
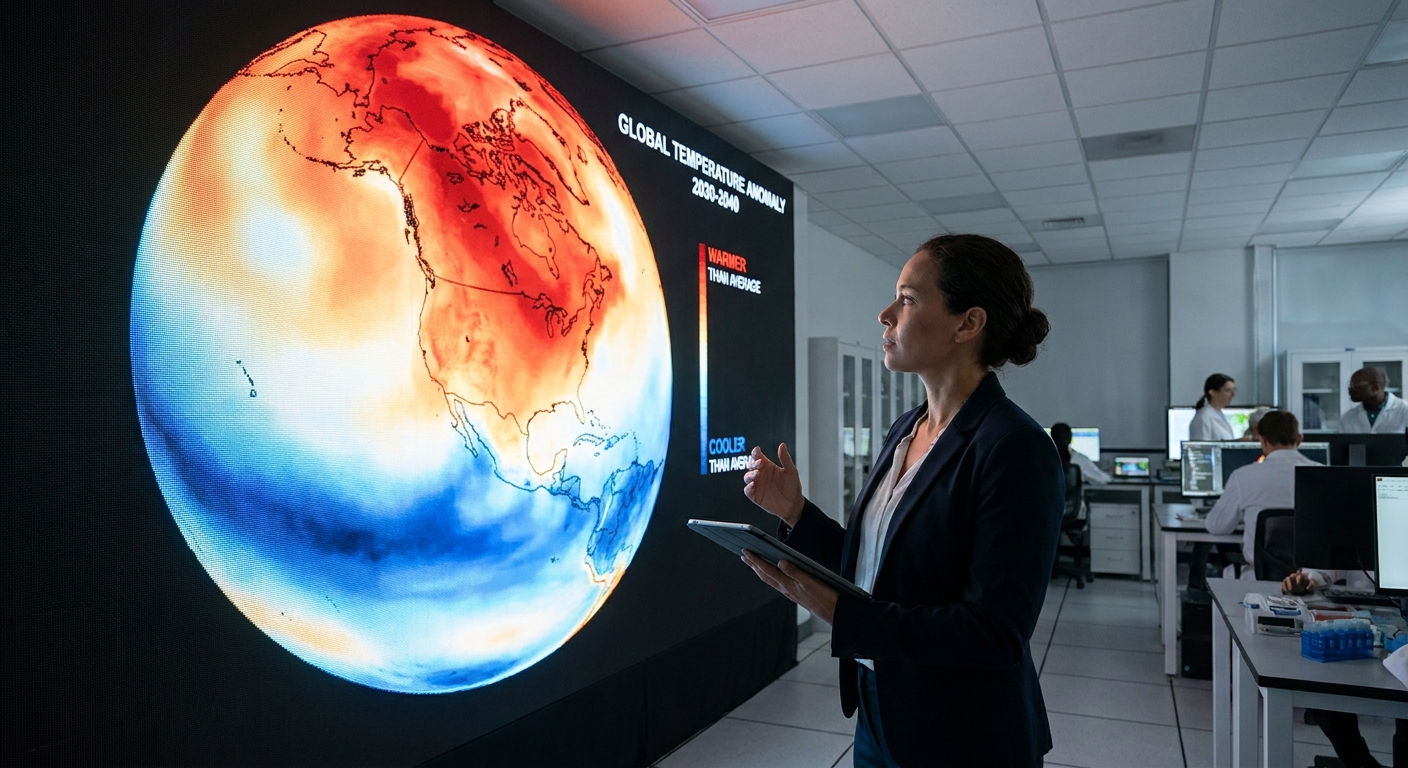
When climate agencies publish a global temperature value for a month or a year, they are most often reporting global mean surface temperature (GMST), usually as an anomaly relative to a reference period. Well-known examples include NASA’s GISTEMP, NOAA’s GlobalTemp, the UK Met Office and CRU’s HadCRUT, and Berkeley Earth.
In plain language, GMST is an estimate of average temperature near Earth’s surface, combining:
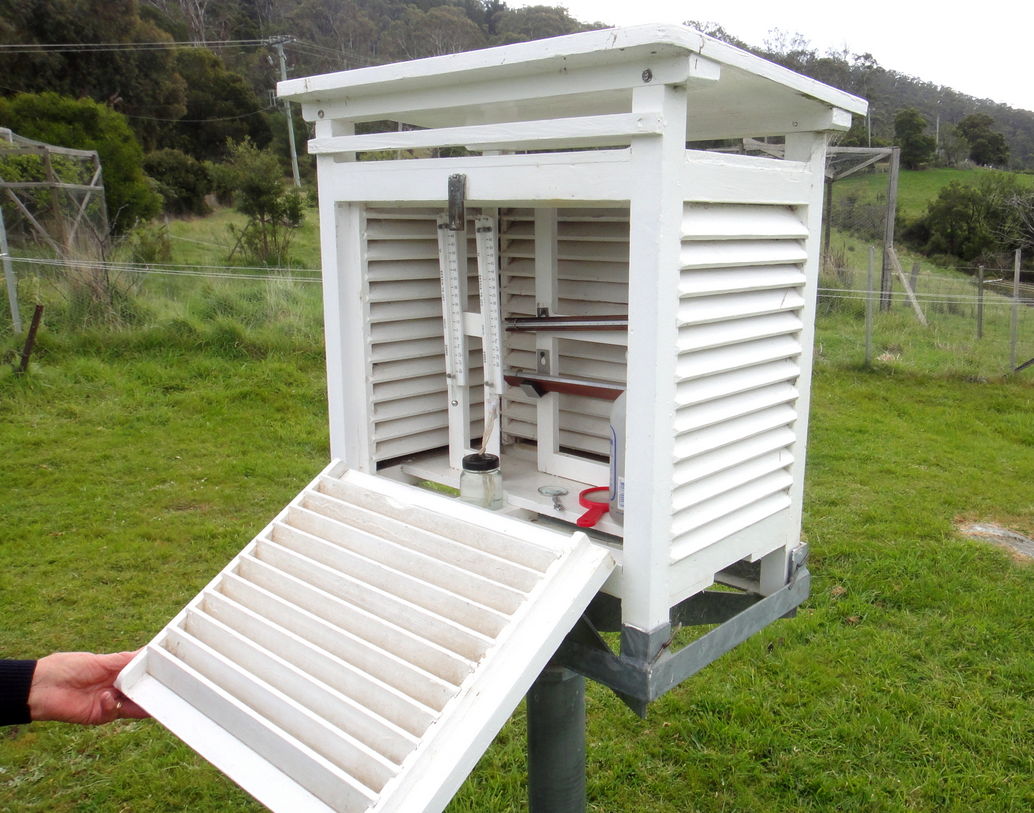
- Air temperature over land, measured at weather stations typically near 2 meters above the ground in a ventilated screen or shelter.
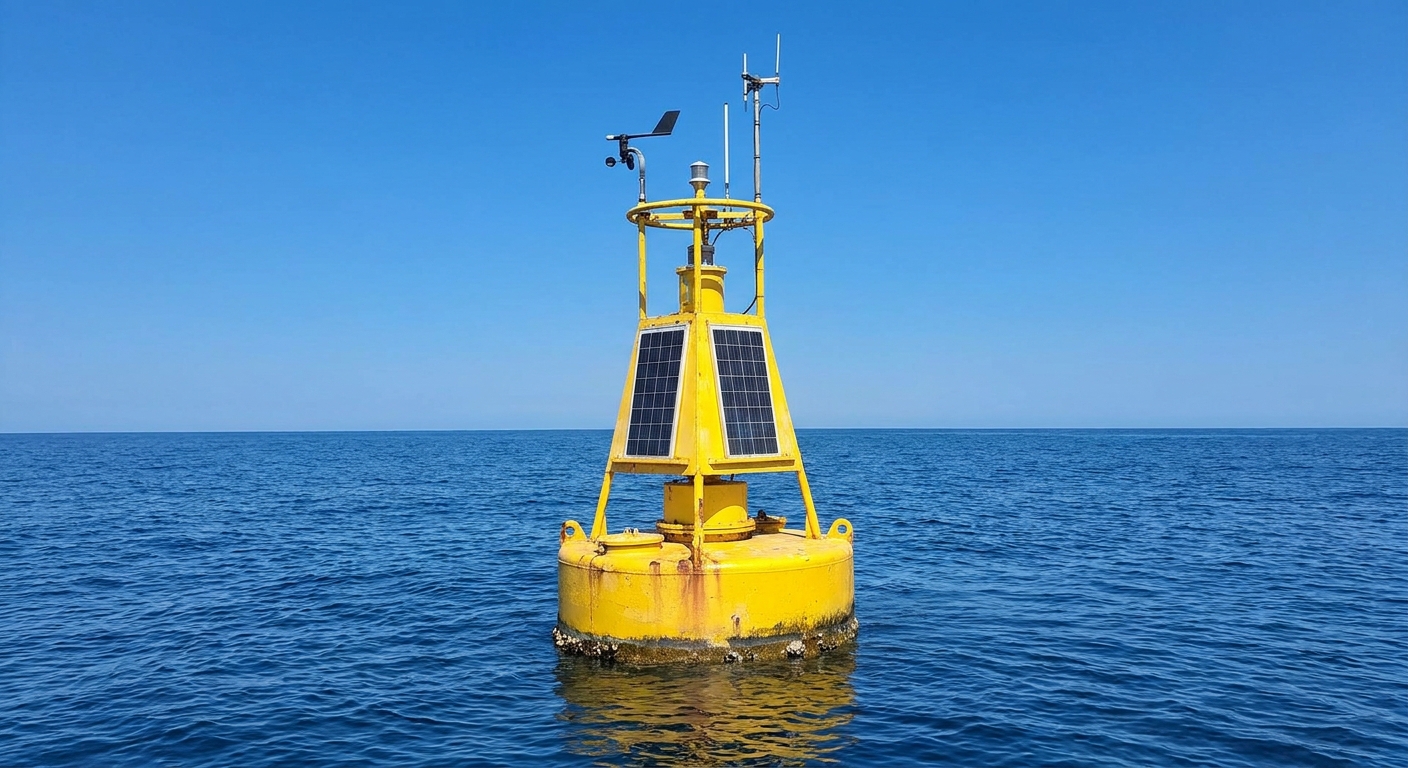
- Sea surface temperature over oceans, measured by ships, buoys, and other platforms.
Two quick clarifications that prevent a lot of confusion:
- It is not the same thing as the temperature everywhere. Earth can have a warmer-than-average year while some regions have an unusually cool season.
- It is not primarily built from satellites. Satellites are extremely valuable, but the most widely cited surface temperature series are built mainly from land stations and ocean measurements. Satellites more directly estimate things like land surface temperature or lower-atmosphere temperature, which are related but not the same metric as GMST.
Where the data comes from
Land stations
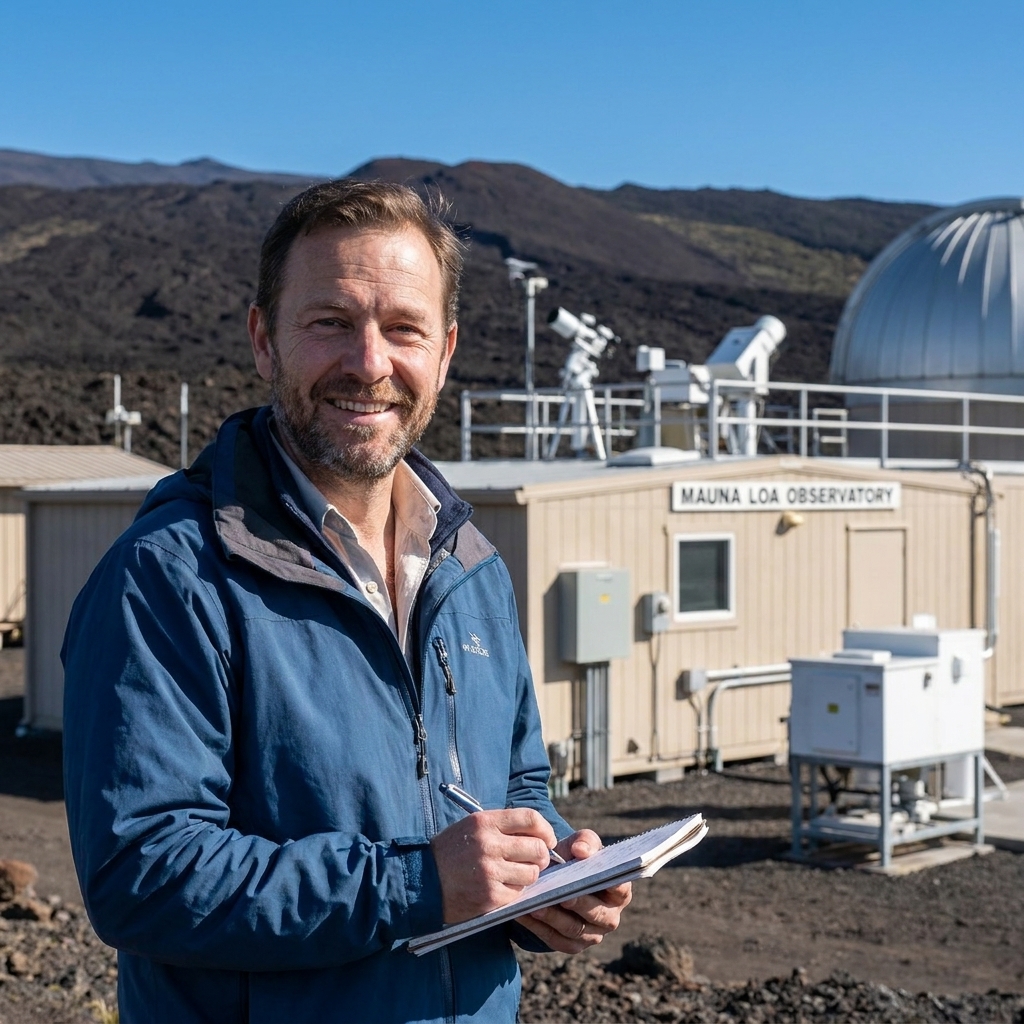
On land, the backbone is weather station air temperature. These stations are run by national meteorological services, research networks, and long-running observing programs. The practical challenge is that stations are not identical over time.
A station might:
- Move a short distance (even a few hundred meters can matter).
- Change instruments (for example, switching from older thermometers to electronic sensors).
- Change observation time (reading in the morning versus afternoon can bias daily averages).
- See its surroundings change (new buildings, new trees, more pavement).
Temperature datasets correct for many of these issues using homogenization, which is a set of methods that look for non-climate jumps in a station record by comparing it to neighboring stations. The goal is not to “make everything match.” It is to remove obvious artifacts so the remaining trend is more likely to reflect real regional climate change.

Ships and buoys
Oceans are measured differently because most ocean observing platforms are not recording “air temperature two meters above the sea.” Instead, global surface datasets typically use sea surface temperature (SST), which is closely linked to how the ocean and atmosphere exchange heat.
Historically, SST came mostly from ships, and ships have used multiple methods over time, including:
- Bucket samples hauled up and measured, which can cool due to evaporation and wind.
- Engine intake measurements, which can run slightly warm because the water travels through the ship.
In recent decades, moored and drifting buoys have become major contributors. Buoy measurements are generally more consistent for SST, but they do not perfectly match ship-based readings. Modern datasets account for these method shifts to avoid turning a change in technology into a fake climate signal.
How it becomes one number
Different research groups implement details differently, but the broad recipe is surprisingly consistent. Here is the version I would put on the whiteboard for my old physics classroom.
1) Use anomalies
If you average absolute temperatures directly, you run into a problem: a station in the Sahara is “hot” and a station in Greenland is “cold,” and that difference is mostly geography, not climate change.
So scientists work with temperature anomalies instead. An anomaly is simply:
anomaly = observed temperature − typical temperature for that place and time of year
The “typical temperature” is computed from a multi-decade baseline. Converting to anomalies helps because even if one station runs systematically warmer than another, both can still show the same warming trend relative to their own normal.
2) Grid the planet
Next, the world is divided into grid cells, often something like 1° by 1° or 2° by 2° latitude and longitude. Each cell might contain:
- Several land stations.
- Ship tracks passing through.
- Moored buoy measurements.
- Or nothing at all for that month.
Within each cell, measurements are combined into a single representative anomaly for that cell and that month.
3) Weight by area
A grid cell near the equator covers a much larger physical area than a cell near the poles. If you simply averaged all grid cells equally, you would accidentally give high latitudes too much influence.
Most global averaging methods apply area weighting, commonly proportional to the cosine of latitude, to ensure that each square kilometer of Earth counts roughly the same.
4) Blend land and ocean
This part surprises people: the final global average is not “50 percent land and 50 percent ocean” or “the average of a land curve and an ocean curve.” It is typically a single area-weighted calculation across the whole surface. That means oceans naturally contribute more to the global mean because they cover more area.
However, land and ocean measurements come from different kinds of instruments (air temperature over land versus SST over ocean). Datasets are designed so those differences do not create artificial jumps, but you should still keep in mind that “surface temperature” is a blended concept.
5) Handle gaps and uncertainty
Coverage is uneven. The Arctic, parts of Africa, sections of the Southern Ocean, and earlier decades of the record often have fewer measurements.
Different datasets handle gaps differently. Common strategies include:
- Leave the cell blank if there are no observations, and compute the global mean from what is available. This can be reasonable if coverage is broad and stable, but it can introduce bias when missing areas are changing faster than observed areas.
- Interpolate from nearby regions, using statistical methods to estimate anomalies in unobserved cells based on patterns in observed cells.
- Use closely related constraints in limited cases, such as specific approaches for sea ice covered regions. Reanalysis products are more commonly used to evaluate and cross-check surface datasets rather than serving as the primary input to headline GMST records.
The important point is that professional datasets do not pretend the gaps do not exist. They quantify uncertainty and update estimates as coverage improves.
Why a baseline is used
Most headlines you see are not “Earth’s average temperature is 15.2°C.” They are “Earth is +1.3°C above preindustrial” or “This year was +0.9°C above the 1951 to 1980 average.”
Baselines are used because they make the number more robust and more interpretable.
Baselines reduce coverage bias
When you use anomalies relative to a baseline, you are focusing on change at each location compared to its own normal. That dampens the influence of station elevation, local geography, and systematic measurement quirks that can distort absolute averages.
Baselines help comparisons
NASA, NOAA, the UK Met Office, Berkeley Earth, and other groups may use different station selections, ocean corrections, and gap-handling methods. Their absolute global means can differ by a fraction of a degree. But their anomalies and trends usually agree closely, especially over recent decades.
Common baseline choices
Different groups choose different reference periods. For example, NASA often uses 1951 to 1980 for public-facing anomalies, and many climate “normals” are reported over 1991 to 2020. When you see “preindustrial” in climate policy contexts, it is often approximated as 1850 to 1900, mainly because that is where the best early instrumental records begin.
One subtle point: choosing a different baseline shifts the zero point, not the trend. If you and I use different baselines, we can still agree on how fast the planet is warming.
Why it may not match your experience
If you live on land, it can feel like the “global average” understates what you are experiencing. That is not necessarily your imagination.
Land areas tend to warm faster than oceans for several reasons, including:
- Water has a huge heat capacity, so oceans soak up energy with a smaller temperature change.
- Evaporation over oceans provides powerful cooling.
- Mixing moves heat downward in the ocean, spreading warming through a thicker layer than most land surfaces.
Since the global mean includes the ocean area, it often warms more slowly than the average over land alone. Many agencies publish both metrics: a global blend and a land-only series.
What it does and does not tell you
What it tells you
- The direction of long-term change. Over decades, the global mean surface temperature trend is one of the clearest signals of a warming planet.
- How unusual a month or year was overall. A record-hot year means the area-weighted global average anomaly was the highest in that dataset, reflecting widespread warmth across many regions.
- A common yardstick for comparing models, impacts, and policy targets.
What it does not tell you
- Today’s weather in your city. Weather is local and chaotic. Global averages are planetary and statistical.
- Whether every place warmed equally. Some regions warm much faster than the global mean (the Arctic is the classic example). Others can warm more slowly, at least for a time.
- Why a specific heat wave happened. The global mean sets the background conditions, but individual events depend on atmospheric patterns, soil moisture, ocean cycles, and more.
If you want a mental model: the global average temperature is like your body’s average temperature over time. It is an excellent health indicator. It does not tell you whether your left hand is cold right now.
Uncertainty is included
Every global temperature dataset includes uncertainty ranges. That uncertainty comes from several sources:
- Measurement error at individual stations and platforms.
- Sampling uncertainty from incomplete coverage, especially earlier in the record and in hard-to-measure regions.
- Method uncertainty from choices about homogenization, ocean bias corrections, and gap handling.
Here is the key: uncertainty ranges are usually much smaller than the long-term warming signal, especially when you look across multiple decades. That is why independent groups using different methods still find very similar warming trends.

FAQ
Is it just the average of all thermometers?
No. It is built by combining many observations into gridded anomalies, applying area weighting, and accounting for measurement changes and coverage gaps over time. Land air temperatures are used over land and sea surface temperatures are used over oceans.
Why not measure the whole planet with satellites?
Satellites are crucial, but they measure radiation and infer temperatures for different layers of the atmosphere or for the land surface, depending on the instrument. The most commonly cited global surface series are built from in situ measurements because they provide a long, consistent record going back well before the satellite era.
Does changing the baseline change the trend?
Changing the baseline changes the zero line, not the slope. A different baseline will shift the anomaly values up or down by a constant amount, but the long-term trend remains essentially the same.
If Earth is warming, why did my town have a cold winter?
Because local weather can swing widely from year to year due to natural variability. Global warming tilts the odds toward more heat overall, but it does not eliminate cold spells or regional cool periods.
The takeaway
The global average temperature is built the way good science often is: not by finding a perfect measurement, but by combining many imperfect measurements thoughtfully. Scientists convert observations to anomalies, grid the planet, weight by area, correct for known measurement quirks, and quantify uncertainty.
That final single number is not meant to tell you what happened on your street today. It is meant to track how the planet’s heat balance is shifting over time. And for that job, it is one of the most powerful, carefully checked indicators we have.