Curiosity, with all its quills showing.
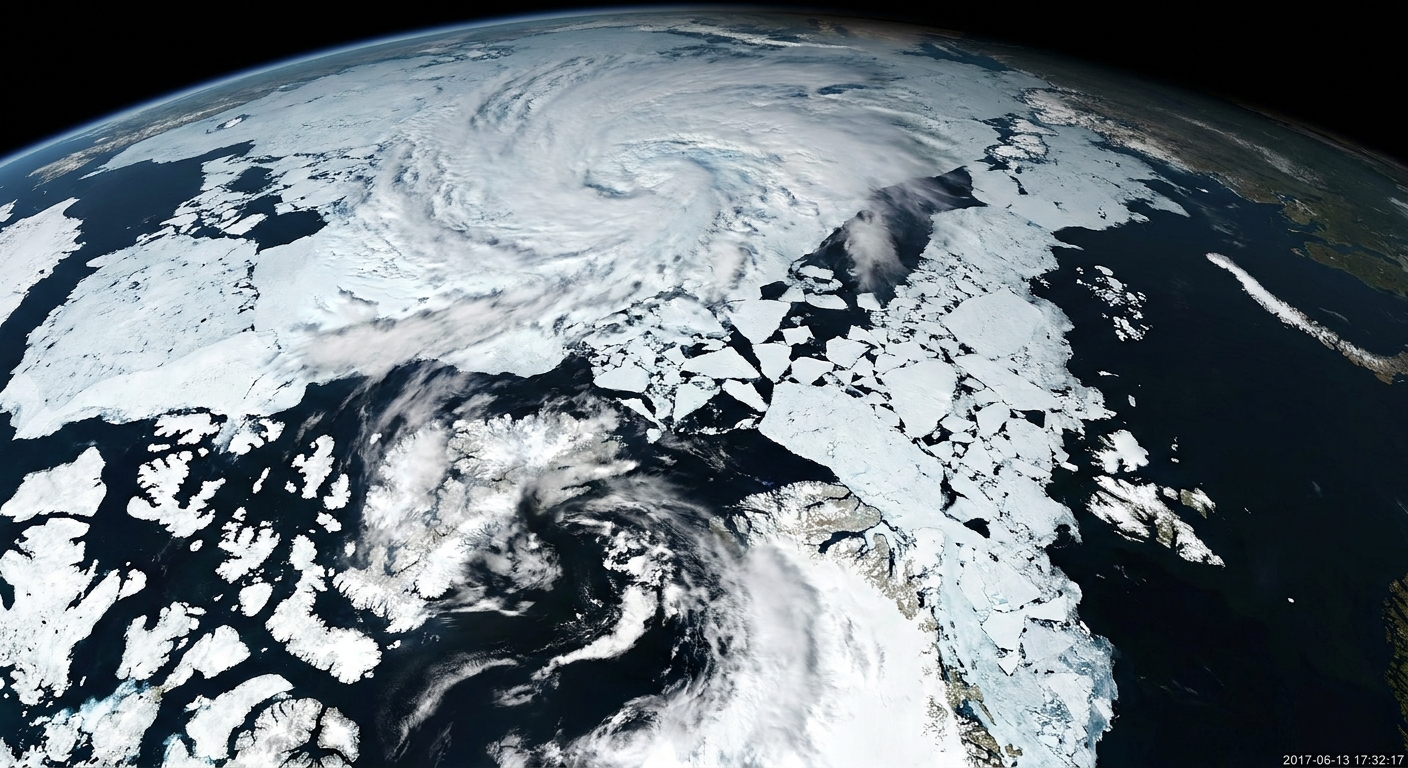
“Sea ice extent” is one of those phrases that sounds simple until you ask a very Quill-like question: what exactly counts as sea ice, and how do we measure it across an entire ocean every day?
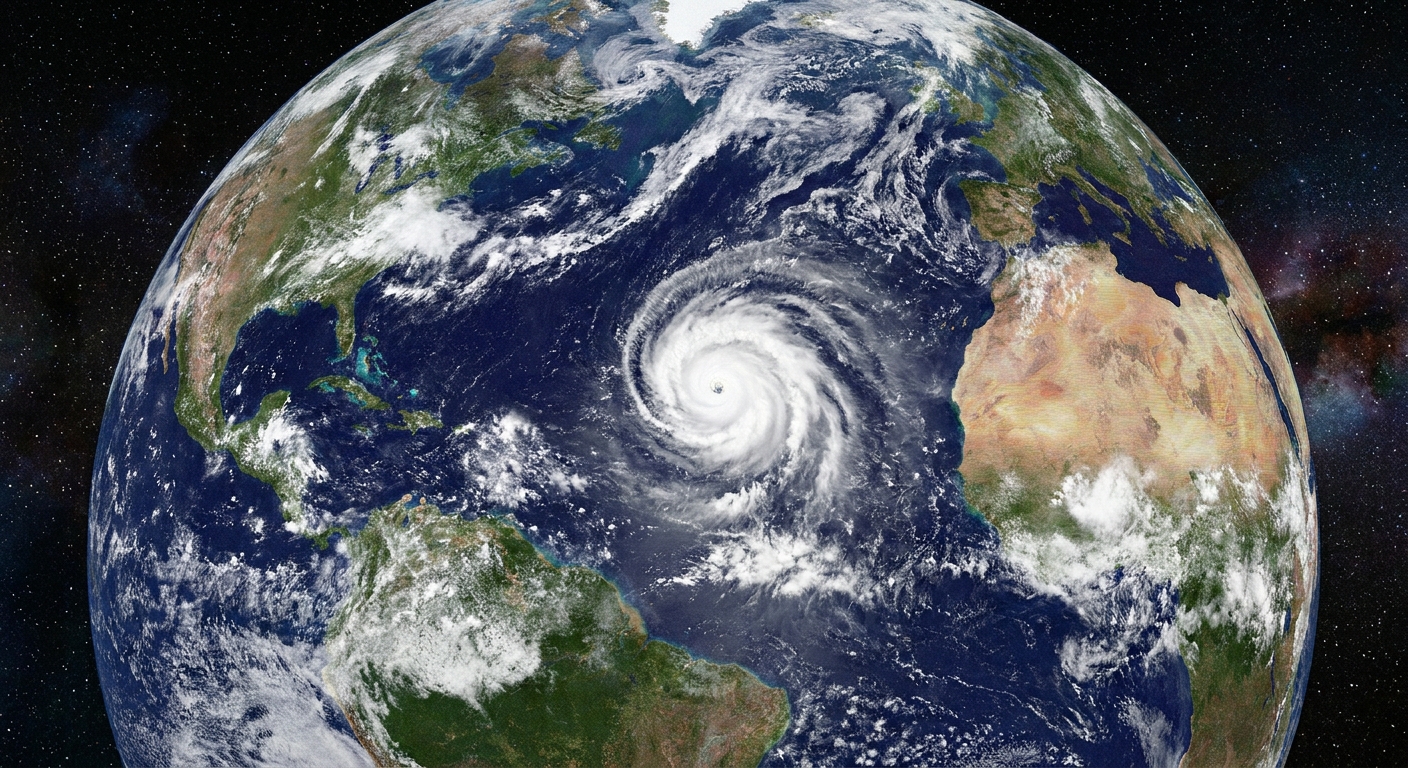
The short version is that scientists mostly rely on satellites that can work through polar night and are largely unaffected by most clouds by measuring natural microwave radiation coming from Earth. From that signal, they estimate how much of each patch of ocean is covered by ice, then add up the patches that cross a standard threshold. The details are where the science lives.
What “sea ice extent” means
Sea ice extent is the total ocean area where sea ice covers at least a set fraction of the surface. In most widely used datasets, that fraction is 15 percent.
Think of the polar ocean divided into a grid of pixels. For each pixel, scientists estimate ice concentration, the fraction of that pixel that is ice rather than open water. Extent is then calculated as:
- Count every grid cell with ice concentration ≥ 15% as “ice-covered”
- Sum the full area of all those qualifying grid cells
That is why extent can sound a bit counterintuitive at first: a grid cell with 20% ice counts the same as a grid cell with 90% ice when you are computing extent. The concentration estimate still exists in the background, but extent is deliberately a thresholded, yes-or-no tally.
How satellites detect sea ice in dark or cloudy skies
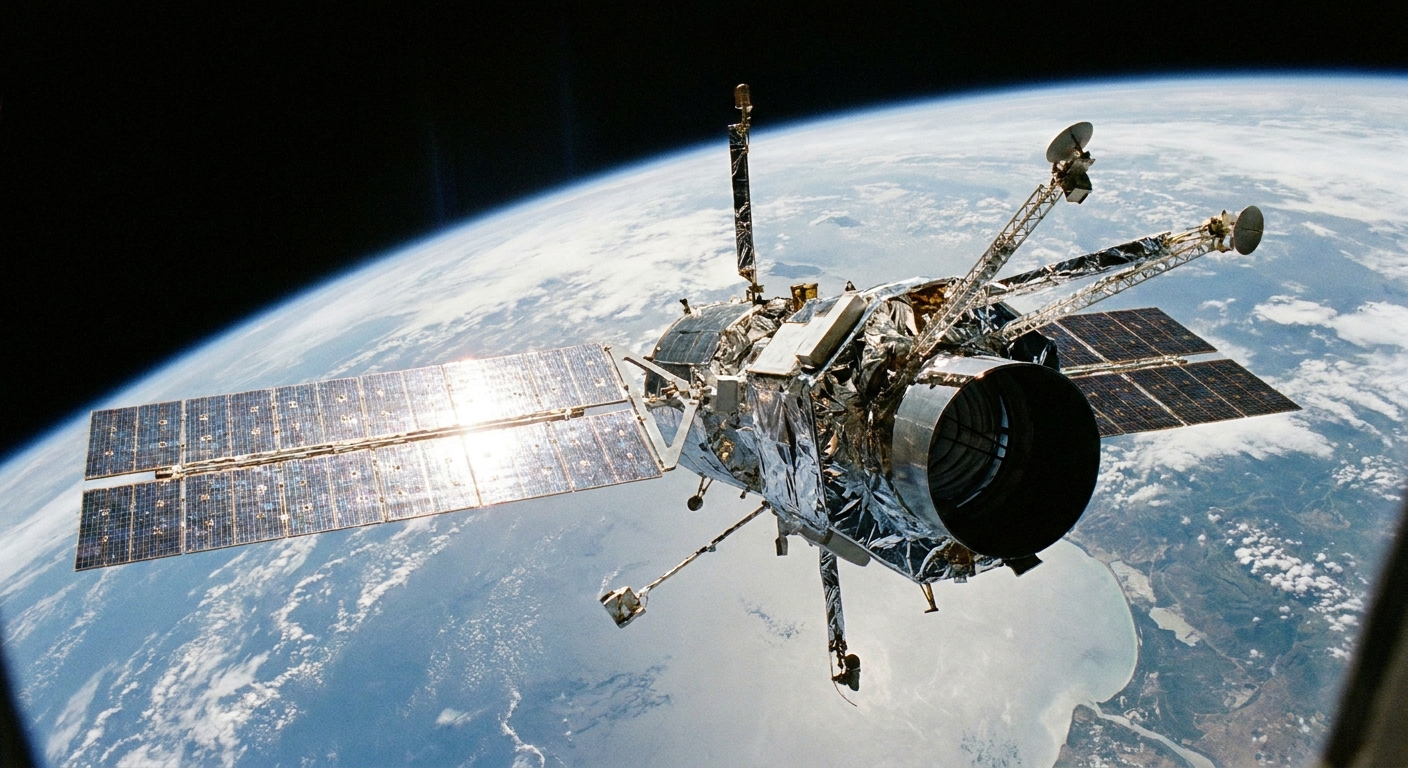
The workhorse for modern sea ice monitoring is passive microwave remote sensing. “Passive” means the satellite instrument is not sending out a radar pulse. It is listening for the natural microwave radiation Earth emits.
Why microwaves are useful at the poles
Microwaves have two practical superpowers for sea ice tracking:
- They work day and night. Polar winter can be months of darkness, which limits ordinary visible-light imagery.
- They are largely unaffected by most clouds. Cloud cover is common over ocean and can block optical sensors, though heavy precipitation and cloud liquid water can still contaminate microwave signals.
Sea ice and open water emit microwaves differently. In remote-sensing terms, they have different brightness temperatures at certain microwave frequencies and polarizations. Algorithms use those differences to estimate ice concentration in each pixel.
What the satellite is actually measuring
A passive-microwave radiometer measures microwave energy at the satellite that reflects a mix of surface emission plus atmospheric effects along the path. That signal is shaped by:
- Surface type (ocean water versus ice)
- Ice conditions (thickness, salinity, surface roughness, snow cover, melt ponds in summer)
- Atmosphere (water vapor, cloud liquid water, precipitation can all add noise)
- Instrument resolution (each pixel represents a footprint that can range from several to tens of kilometers across, depending on sensor and channel; many long-running daily products are commonly gridded around ~10 to 25 km)
From that mixed signal, sea-ice concentration is estimated using established retrieval methods, then gridded into daily maps that can be compared through time.
Why the 15% threshold is common
The 15 percent cutoff is not magic, but it is practical. It became a convention because it tends to:
- Reduce false positives caused by noise or weather effects that can make open ocean look slightly “ice-like” at microwave wavelengths
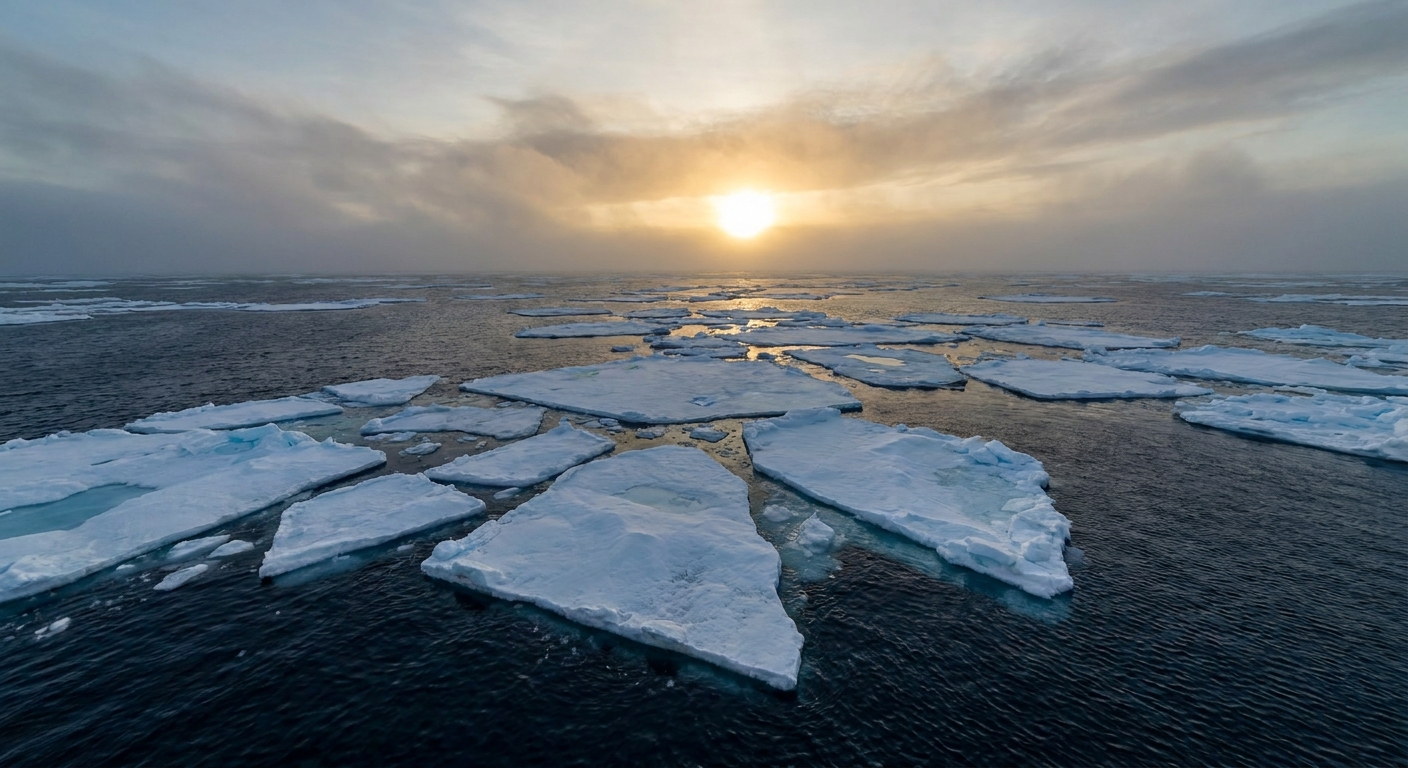
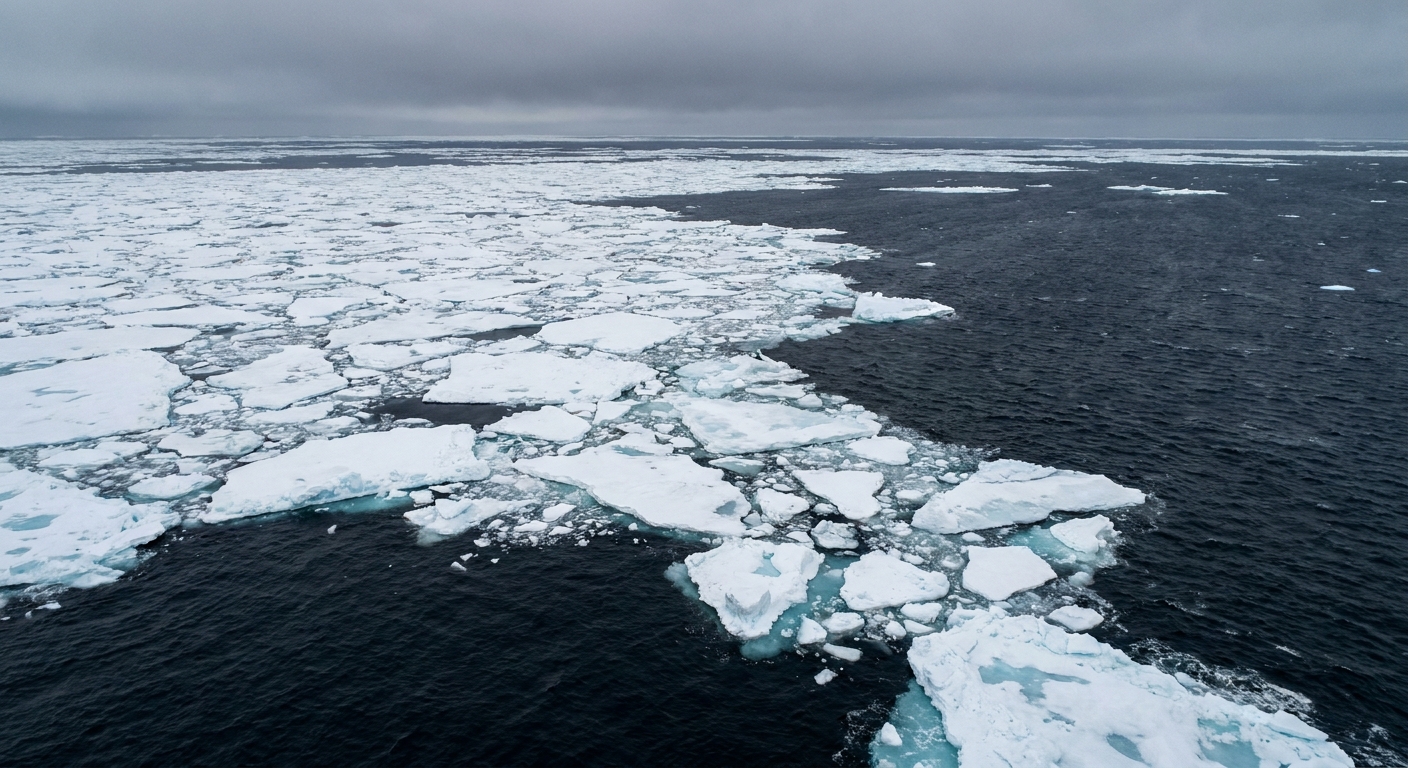
- Handle mixed-edge zones near the ice margin, where you often have a patchwork of ice floes and open water
- Support consistency across sensors and decades, which is essential for long-term records
Could scientists use 10% or 30% instead? Yes. The answer would change slightly, especially along the ice edge. But for climate monitoring, a stable definition applied the same way over time is often more valuable than chasing a “perfect” boundary that shifts with method and conditions.
Extent vs area vs volume
If you remember only one thing, let it be this: extent, area, and volume are not interchangeable. They summarize different aspects of the ice cover.
Sea ice extent
- Definition: Sum of grid-cell areas where concentration is ≥ 15%
- Best for: Tracking where ice is present across broad regions and comparing seasons and years
- Limitation: Ignores whether qualifying grid cells are 16% ice or 96% ice
Sea ice area
Sea ice area uses the concentration value rather than a binary cutoff. In each grid cell, you multiply:
- Grid-cell area × ice concentration
Then you sum over the region. So a 25% ice cell contributes one quarter of its area to the total.
- Best for: Capturing changes in how “packed” the ice is, not just where it exists
- Limitation: More sensitive to concentration retrieval errors, especially during summer melt when the surface gets complicated
Sea ice volume
Sea ice volume is the truly three-dimensional quantity: area times thickness (summed over a region). It is often described as the amount of ice “stored” in the ocean.
- Best for: Understanding how robust the ice pack is and how much ice must melt to disappear
- Limitation: Thickness is harder to measure from space than extent, and uncertainties are generally larger. It can be estimated using altimetry (measuring ice freeboard) and models that blend observations with physics.
In other words: extent tells you where ice shows up, area tells you how much of the surface is actually ice, and volume tells you how much ice mass is there to lose.
From signal to daily map
Behind a simple-looking “sea ice extent” graph is a pipeline of careful steps designed to turn a microwave measurement into a stable time series.
1) Collect radiometer observations
Satellites measure microwave brightness temperatures across multiple frequencies and polarizations. Different channels help distinguish ice from open water and manage atmospheric interference.
2) Estimate ice concentration
Researchers use concentration retrieval algorithms that relate microwave signals to mixtures of ice and water. Different algorithms exist, and they can disagree slightly, especially in tricky conditions. You may see names like NASA Team and Bootstrap in technical documentation.
These methods must also handle cases like:
- Summer melt ponds that can look more like open water
- Thin ice near the ice edge
- Weather effects that add microwave emission from the atmosphere
3) Grid results and apply masks
Concentrations are mapped onto a standard grid so that day-to-day and year-to-year comparisons are possible. Coastlines and certain problematic regions are handled with masks so land does not contaminate ocean pixels.
4) Compute extent
Finally, count the grid cells at or above 15% concentration and sum their areas. Repeat daily. Now you have a time series.
How accurate is sea ice extent
Sea ice products come with uncertainties. Rather than a single “error bar,” uncertainty depends on season, region, and conditions.
Common sources of uncertainty include:
- Spatial resolution: A pixel can include both ice and water, especially near the edge. The ice margin is a “mixed pixel” factory.
- Surface changes: Wet snow and melt ponds during summer can make ice look less icy to a microwave sensor.
- Atmospheric noise: Water vapor, cloud liquid water, and precipitation can influence the signal.
- Sensor changes over decades: Long records span multiple satellites. Teams work to intercalibrate sensors so the time series stays consistent.
- Algorithm differences: Two well-regarded methods can produce slightly different concentration maps, and that can ripple into slightly different extents, particularly near the ice edge and during melt.
The important point is that the methods are designed for consistency. Even when individual daily values have uncertainty, a well-maintained record can reliably reveal seasonal cycles and longer-term changes.
Why one minimum is not the whole story
Sea ice hits a low point each year near the end of the melt season (late summer in the Arctic). That annual minimum is a natural headline magnet, but a single year can be pushed around by weather patterns, winds that compact or spread the ice, and short-term ocean conditions.
To learn something durable, scientists lean on a long satellite record because it lets them:
- Compare a given year to many previous years under the same definition of extent
- Separate short-term variability from sustained change
- Quantify trends with enough data to be meaningful
In climate, the signal is often shy. It likes to hide inside noisy year-to-year swings. Long records are how you coax it into view.
And yes, sea ice loss also interacts with Arctic warming feedbacks such as changes in reflectivity, but that is a bigger story for another page.
Common questions
Is sea ice extent measured only by satellites?
Satellites are the backbone for continuous, basin-wide monitoring, especially since they can cover remote regions daily. Scientists also use ship observations, buoys, aircraft campaigns, and coastal radar in specific places, but those are not global, all-season replacements for satellite mapping.
Why not use visible-light satellite pictures instead?
Visible imagery can be beautiful and detailed, but it depends on daylight and clear skies. Passive microwave data sacrifice sharpness for reliability. At the poles, reliability tends to win.
Can extent go up even if the ice is thinner?
Yes. Extent is about surface coverage, not thickness. You can have widespread, thin ice that produces a relatively large extent, while volume could still be low.
Does “15% ice” mean ships can easily pass through?
Not necessarily. A 15% concentration is an average over a large pixel. Locally, the ice could be clumped into dangerous floes, or the open water could be in narrow leads. Navigation decisions use specialized ice charts and higher-resolution information, not just climate-monitoring extent.