I still remember the first time I showed my students the Keeling Curve. A few of them expected a straight line. Instead, the graph looked like a jagged staircase steadily climbing upward. That little zigzag did something magical in the classroom: it made the atmosphere feel alive. Breathing. Growing. Changing.
The Keeling Curve is exactly that kind of “alive” dataset. It is our most famous long-running measurement of carbon dioxide in Earth’s atmosphere, and it has become one of the clearest pieces of evidence that the air around us is changing in a measurable, persistent way.
The Keeling Curve in plain language
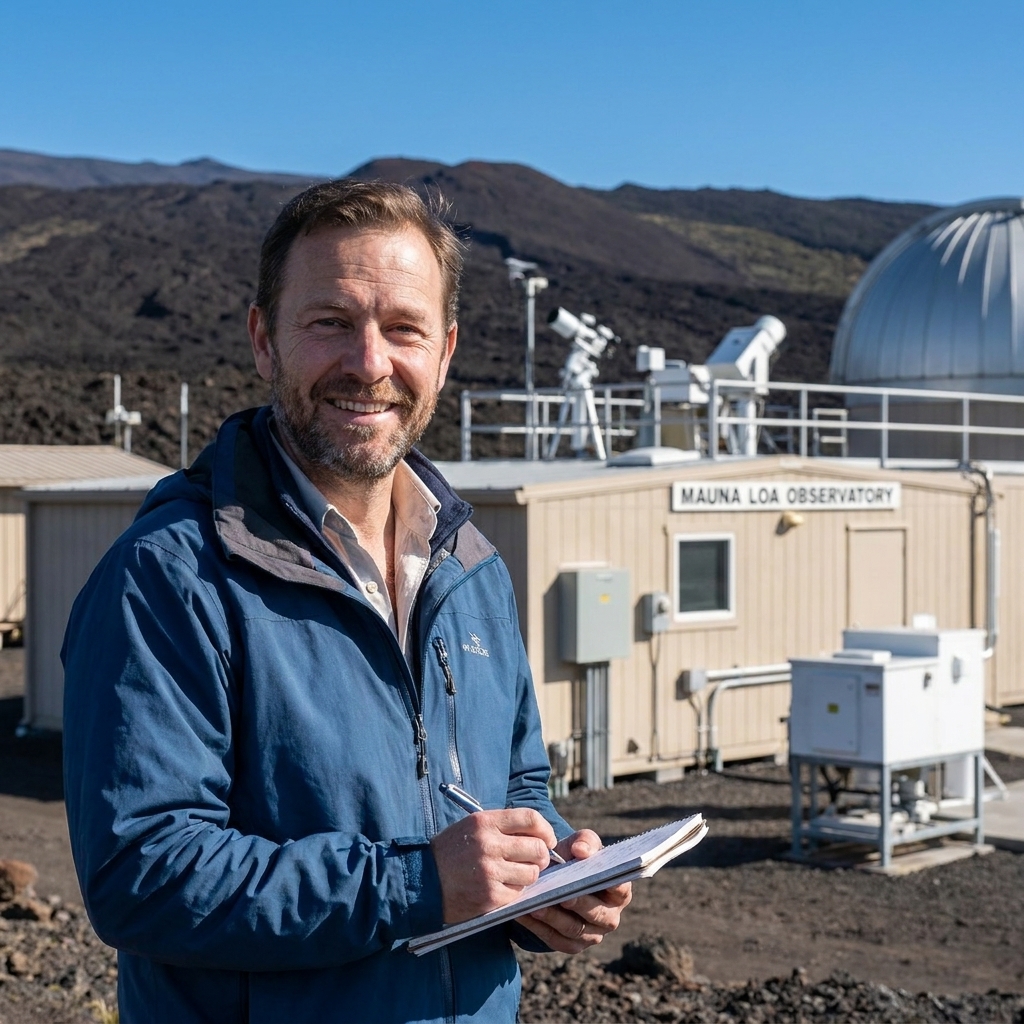
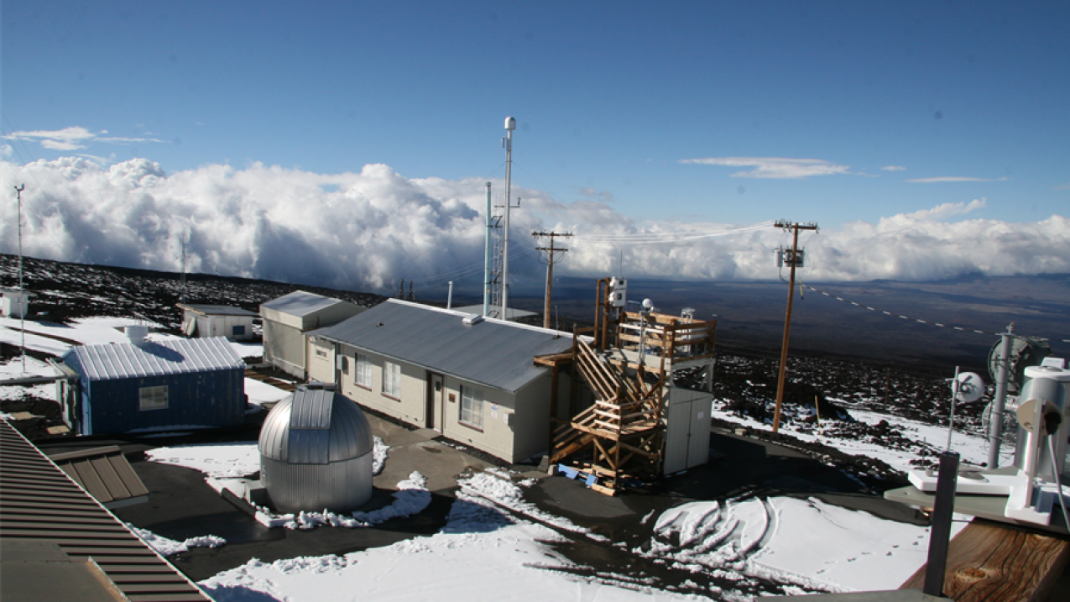
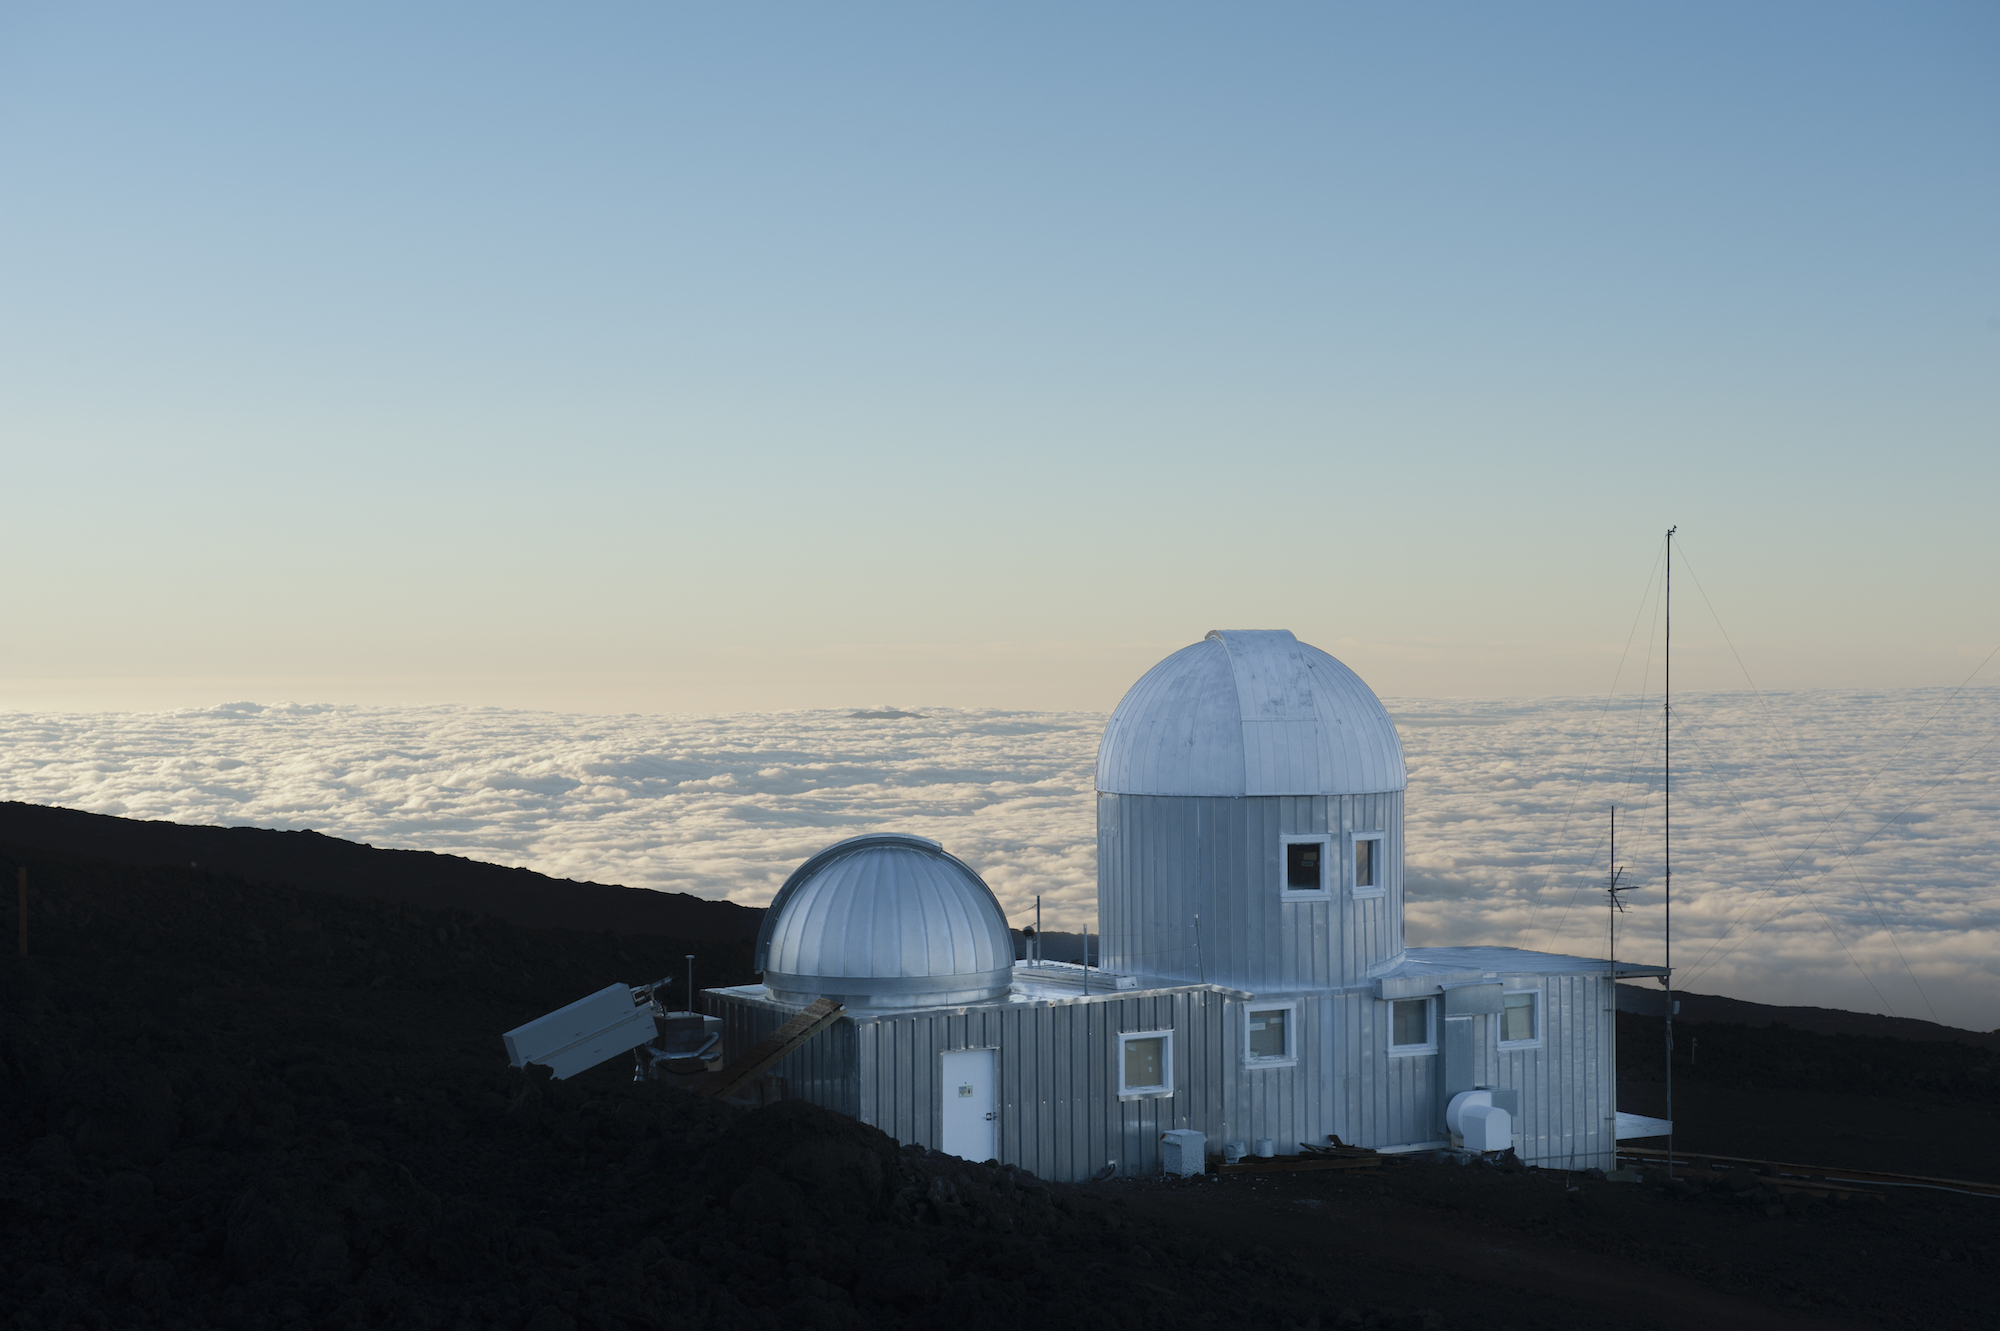
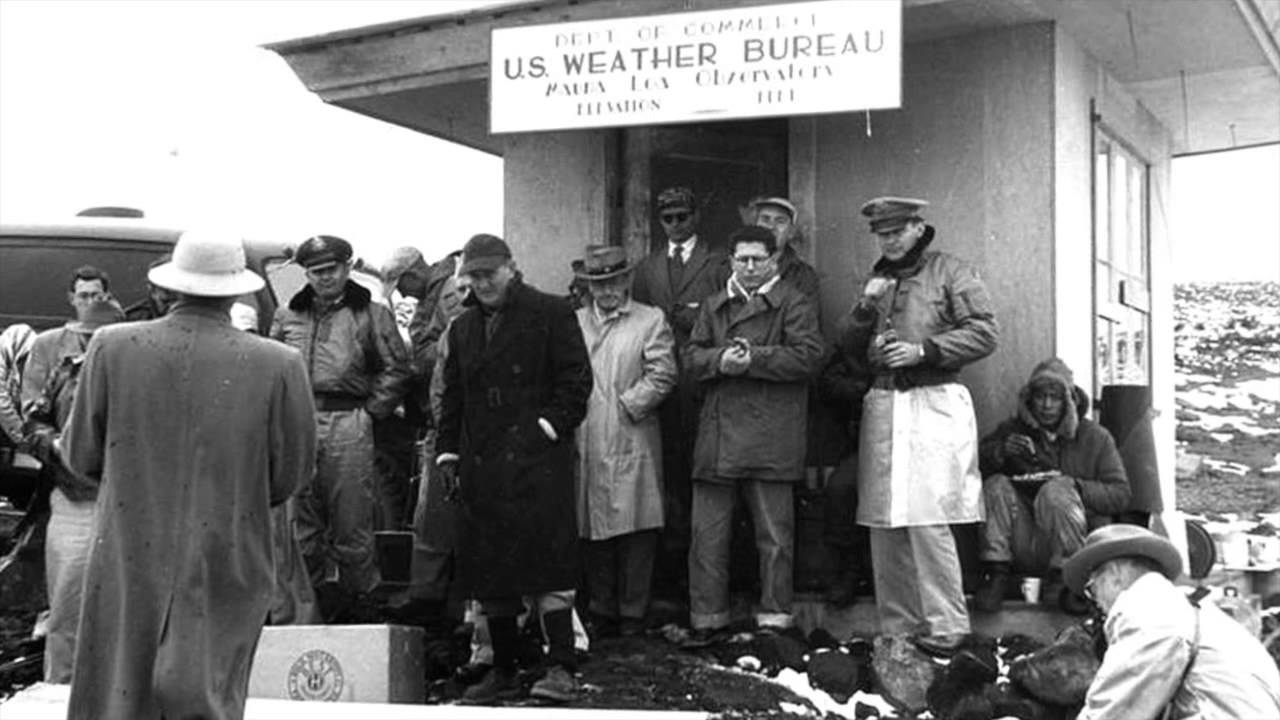
The Keeling Curve is a long-running record of atmospheric carbon dioxide (CO2) measured at the Mauna Loa Observatory in Hawaii. It began in 1958, when scientist Charles David Keeling and colleagues established careful, standardized measurements of CO2 in clean, remote air. The record is often described as continuous, and in practice it is nearly continuous, with occasional interruptions over the decades.
When people talk about “CO2 levels” in the atmosphere, they may mean several related things. In popular conversation, the Keeling Curve is often the iconic reference. In scientific reports, you will also see global mean CO2 values computed from many monitoring sites. The key point is that Mauna Loa’s curve and global averages tell the same story about the long-term rise.
CO2 is reported in parts per million (ppm). That unit is literal: out of one million molecules of dry air, how many are CO2.
What it shows at a glance
- A long-term rise in atmospheric CO2 over decades.
- A repeating seasonal up-and-down superimposed on that rise, like a heartbeat on a moving escalator.
Why Mauna Loa is a key reference
If you have ever stood near a busy road and then walked into a forest, you know the air can vary from place to place. So why do scientists trust one observatory on one mountain as a major reference point?
Because Mauna Loa is positioned to measure what climate scientists call the well-mixed background atmosphere, meaning air that is not dominated by nearby sources like tailpipes, smokestacks, or dense vegetation.
The location matters
- Remote in the middle of the Pacific, far from major industrial centers.
- High elevation (about 3,397 meters), often sampling air above the local boundary layer where ground-level “noise” is strongest.
- Prevailing winds frequently bring in air that has traveled long distances over ocean, mixing along the way.
In other words, Mauna Loa is like taking your measurement upstream, before the local tributaries muddy the reading.
It also helps to remember that Mauna Loa is not alone. There are CO2 stations around the world, including at the South Pole and across broader monitoring networks. Mauna Loa’s special role is its long, consistent time series. Other sites and global averages corroborate the same long-term trend.
The upward trend
The most important message of the Keeling Curve is simple: atmospheric CO2 has increased dramatically since measurements began.
In 1958, Mauna Loa measurements were a bit above 300 ppm. Today, they are well over 400 ppm. That is not a small tweak. It is a large, sustained shift in the composition of the air.
Why the rise is linked to us
CO2 goes up when we add carbon to the atmosphere faster than natural processes can remove it. The biggest human drivers are:
- Burning fossil fuels (coal, oil, natural gas) for electricity, transportation, heating, and industry.
- Cement production, which releases CO2 during chemical processing.
- Deforestation and land use change, which reduce the planet’s ability to store carbon in biomass and soils.
Natural systems still absorb a large fraction of what we emit. Oceans dissolve CO2, and land ecosystems store carbon in plants and soils. But the Keeling Curve shows very clearly that these sinks are not keeping up with emissions.
The zigzag
Now for that jagged sawtooth pattern. It surprises people because they assume “pollution” should only go up. But the atmosphere is not only shaped by engines and factories. It is also shaped by leaves.
The seasonal cycle is the Northern Hemisphere breathing
Most of Earth’s land and much of its vegetation sits in the Northern Hemisphere. That matters because plants pull CO2 out of the air through photosynthesis and return CO2 through respiration and decay.
- Spring and summer: Northern forests, grasslands, and croplands ramp up photosynthesis. CO2 in the air tends to drop.
- Fall and winter: Photosynthesis slows while respiration and decomposition continue. CO2 tends to rise.
At Mauna Loa, that seasonal “breathing” is typically on the order of about 6 to 8 ppm from peak to trough. The timing is also fairly consistent: CO2 often peaks in late spring and reaches a minimum in early fall.
One neat detail: if you compare stations in the Northern and Southern Hemispheres, the seasonal swing is usually smaller in the south, because there is less land vegetation driving the cycle.
Why scientists trust the curve
A record is only as good as its methods. The reason the Keeling Curve carries so much scientific weight is not just its length. It is the discipline behind the measurements.
How the data stays clean
- Long-term sampling over many decades, using calibrated instruments and consistent procedures.
- Quality control to reduce local influence, such as excluding air masses associated with unusual wind patterns or short-term spikes that suggest nearby contamination.
- Calibration against standards so that a reading from the 1960s is comparable to a reading from this month.
Mauna Loa is on an active volcano, which raises a fair question: could volcanic CO2 skew the record? The monitoring program accounts for this by flagging and filtering data when local volcanic influence is detectable, using meteorology and other screening checks. The goal is to preserve the background signal as reliably as possible.
Why it matters
The Keeling Curve is often shown as a climate change emblem, but it is more than a symbol. It is a measurement that connects directly to physics and chemistry.
CO2 shifts Earth’s energy balance
CO2 is a greenhouse gas. Increasing its concentration makes the atmosphere more effective at absorbing and re-emitting infrared radiation, which shifts Earth’s energy balance toward warming. The Keeling Curve does not, by itself, tell you exactly how much warming will occur. What it does is provide a precise record of a key “control knob” that influences global temperature.
It also changes ocean chemistry
As atmospheric CO2 rises, more CO2 dissolves into seawater, which lowers pH and reduces carbonate ion availability. So that rising line is tied not only to heat, but also to changes in marine environments.
Common questions
Is the Keeling Curve the same as “global CO2”?
Not exactly. It is a single location measurement, designed to track the global background. Because the atmosphere mixes on timescales of months to a couple of years, a remote site like Mauna Loa can closely reflect broader trends. For “global CO2,” scientists also compute global averages from many sites. The long-term rise shows up in both.
Why does CO2 keep increasing even though plants absorb CO2?
Plants and oceans absorb a lot of CO2, but human emissions add CO2 faster than these natural sinks can remove it. Think of it like filling a bathtub faster than the drain can empty it. The water level still rises, even if the drain is working.
Does the seasonal zigzag mean climate change is “natural”?
The seasonal cycle is natural, but the upward trend is the crucial part. The zigzag is the planet’s annual carbon exchange with vegetation. The rising baseline is the long-term buildup of CO2 in the atmosphere.
What would it take for the curve to stop rising?
For the curve to flatten, global CO2 emissions would need to fall to the point where natural sinks can absorb what remains. For it to trend downward, emissions would need to drop even further, and additional CO2 would need to be removed from the atmosphere over time.
A curve that taught us how to watch the air
When I take my dog Quark on a hike, I sometimes stop and look up at the sky and think: this is a fluid ocean we live at the bottom of. The Keeling Curve is one of humanity’s clearest, longest-running ways of measuring that ocean’s changing chemistry.
It is deceptively simple: a line that goes up with a yearly wiggle. But inside that line is a story about energy, biology, industry, and a planet that keeps careful accounts, whether we check them or not.