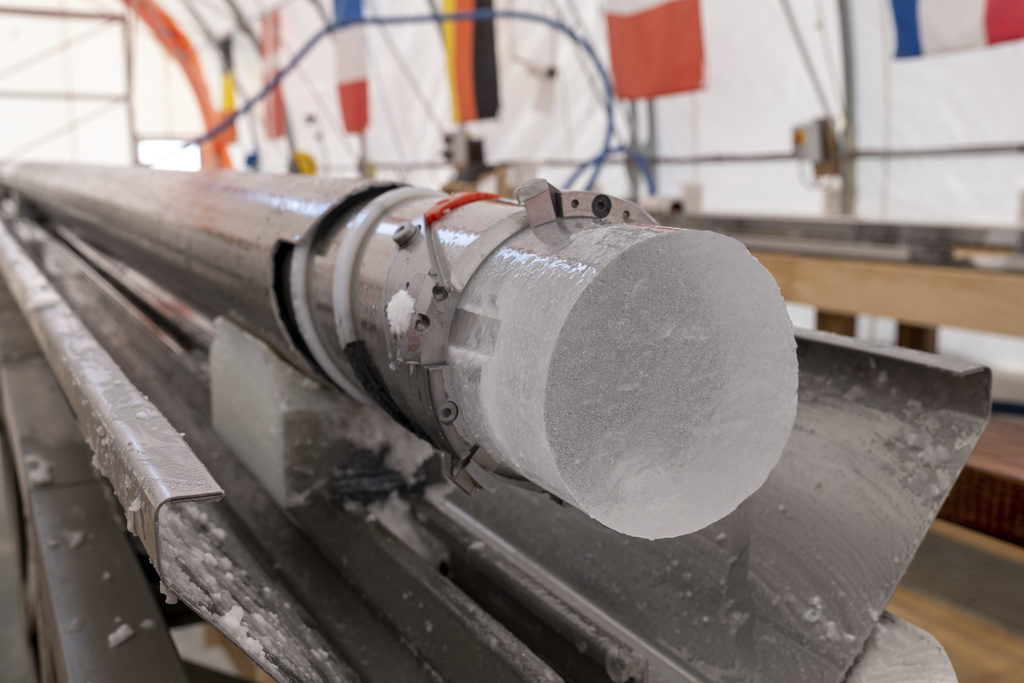
The first time I held a photo of an ice core in my classroom, my students thought it looked like a giant frozen churro. Fair guess. But to a climate scientist, that cylinder of ice is closer to a hard drive than a snack: it stores physical traces of ancient winters, summers, storms, and even the air people breathed tens of thousands of years ago.
Ice cores are drilled from ice sheets and glaciers, most famously in Greenland and Antarctica. Each core contains layers of snow that fell long ago, slowly compacted into ice. Inside those layers are two big kinds of clues: the chemistry of the water itself, and tiny bubbles of ancient atmosphere sealed in like microscopic time capsules.
Ice sheets as layered climate archives
In places that stay cold year-round, snow does not fully melt in summer. Instead, new snowfall piles on top of old snowfall. Over time, the weight of the accumulating snow squeezes lower layers into dense, grainy snow called firn, and eventually into solid glacial ice.
That stacking process creates layers that are often annual or near-annual, especially in Greenland where snowfall is relatively high. Think of it like a layer cake where each year adds a new frosting stripe. Some stripes are thicker, some thinner, and some are dustier depending on weather patterns, wind, volcanic eruptions, and distant deserts.
When scientists drill an ice core, they pull up a vertical timeline. The top is the most recent snow. The deeper you go, the further back in time you go.
A question I hear a lot is, “How do you know the age?” In younger parts of many cores, scientists can count annual layers the way you might count tree rings. Deeper down, they lean more on time markers such as volcanic sulfate layers, plus ice-flow modeling and cross-checks against other records.
How water isotopes reveal past temperature
Water is mostly H2O, but not all water molecules are identical. Some contain heavier versions of hydrogen and oxygen, called stable isotopes. The key measurements in the ice-core story are:
- Oxygen-18 (written as δ18O)
- Deuterium, a heavier hydrogen isotope (often written as δD)
Here is the key idea: temperature strongly influences which isotopes make it into snowfall. But it is not the only influence. Moisture source region, storm track, seasonality, and local atmospheric structure (especially over Antarctica) can also shape the isotope signal.
When ocean water evaporates, lighter molecules tend to evaporate a bit more easily. As that moist air moves toward colder regions and the water vapor condenses into rain or snow, heavier isotopes tend to drop out first. In very cold conditions, by the time a storm reaches the interior of Greenland or Antarctica, the remaining vapor is especially depleted in the heavier isotopes. The snow that falls carries that signature.
So, colder conditions generally mean:
- Lower δ18O and δD values in the snow and ice
Warmer conditions generally mean:
- Higher δ18O and δD values
This does not give an exact thermometer reading by itself. Scientists calibrate isotope changes using modern observations, regional climate models, and other measurements. But the isotope record is one of the most continuous and best-studied ways we have to track long-term temperature swings, especially in polar regions.
Air bubbles: ancient atmosphere in a sealed jar
Water isotopes tell us about the snow and temperature. Ice cores can also preserve something even more direct: old air.
These are two independent lines of evidence that scientists can line up, but they have different clocks, so you have to keep the timelines straight.
As snow turns into firn, it is still porous. Air can move between the grains, meaning the firn breathes with the atmosphere above. Deeper down, the pores gradually pinch off and close. At that point, small pockets of air become sealed as bubbles inside the ice.
The close-off happens at a site-specific depth often called the lock-in depth. And because air keeps mixing in the firn until then, the bubbles do not represent a single instant. They represent a small age distribution, which slightly smooths very rapid changes.
Those bubbles are samples of the atmosphere at the time the pores closed, which is usually later than when the snow originally fell. This is why ice-core studies talk about two related but different timelines:
- Ice age: when the snow fell
- Gas age: when the air got trapped and sealed into bubbles
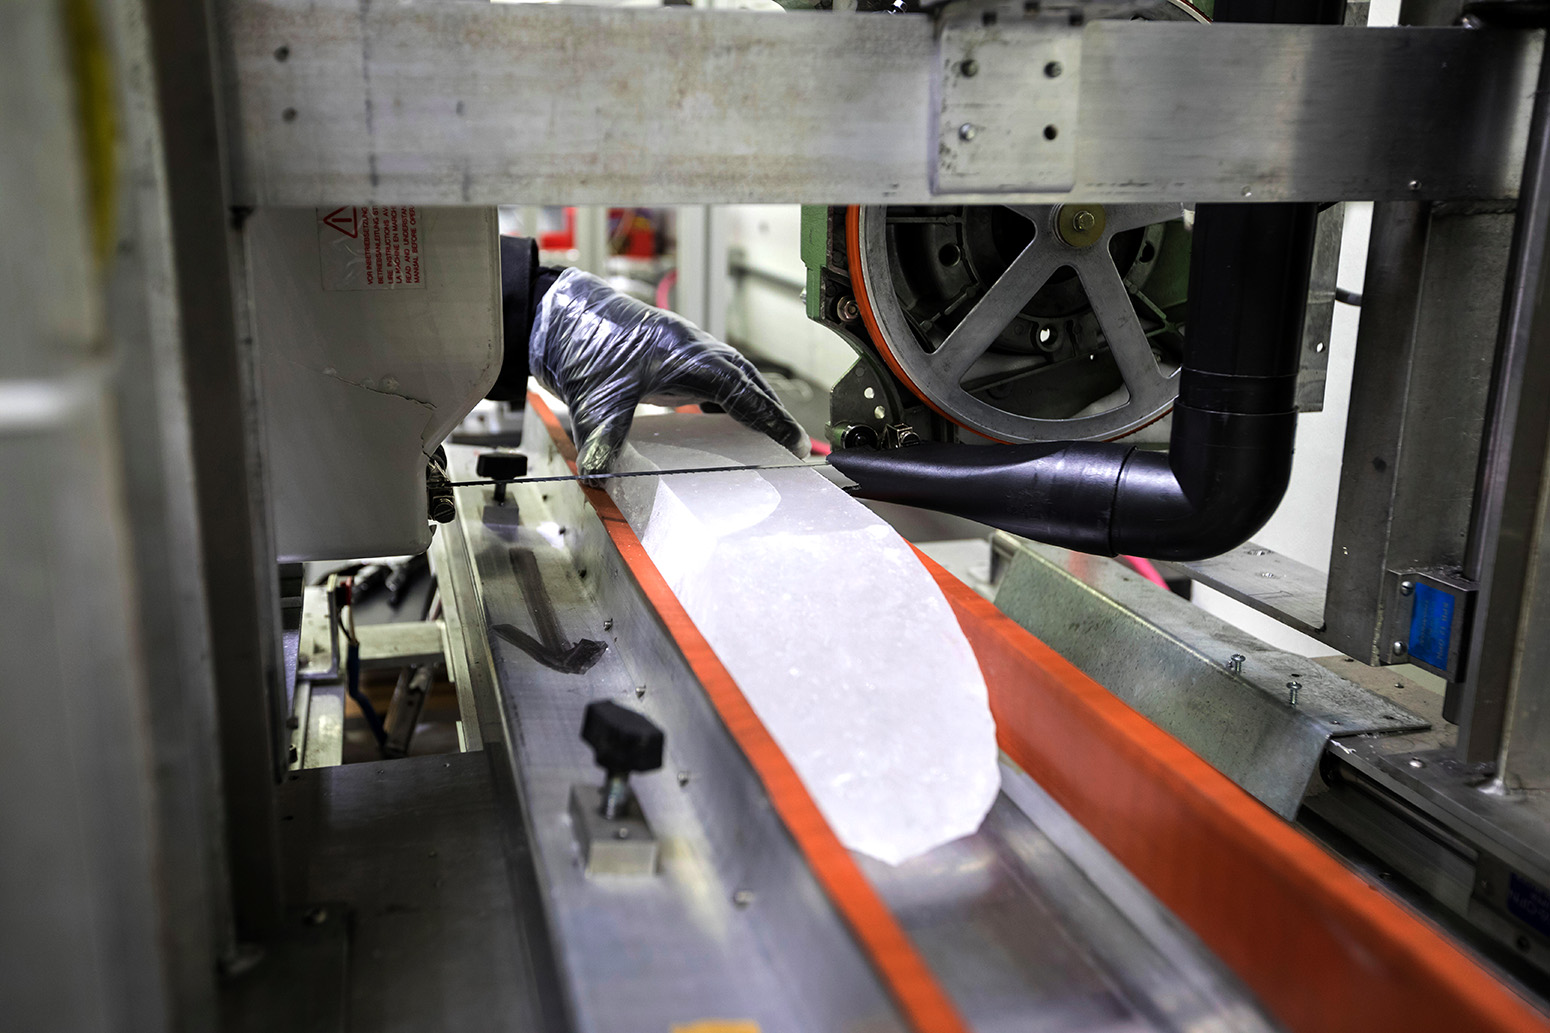
Once the bubbles are sealed, scientists can extract and analyze the gases. That is how we get direct records of greenhouse gases such as:
- Carbon dioxide (CO2)
- Methane (CH4)
- Nitrous oxide (N2O)
In other words, ice cores do not just hint at past climate. They preserve actual samples of past atmospheres.
What an ice core can tell you about CO2 and cold periods
If you line up the temperature proxy (from isotopes) with greenhouse gases (from bubbles), a powerful pattern shows up again and again: during glacial periods, the planet is colder and atmospheric CO2 is lower. During interglacial periods, the planet warms and CO2 rises.
One of the clearest examples is the rhythm of Earth’s ice ages over the last several hundred thousand years. Antarctic ice cores, in particular, show repeated swings where:
- CO2 typically sits around roughly 180 ppm during glacial maxima
- CO2 rises to about 260 to 280 ppm during warm interglacials prior to the industrial era
Ice cores also capture abrupt climate shifts. Greenland cores famously record rapid jumps in temperature during the last ice age, with dramatic changes unfolding over decades, and in some intervals possibly within just a few years in parts of the record. That kind of speed is hard to see in many other natural archives.
Beyond temperature and CO2, cores can contain additional “seasoning” that helps interpret what happened:
- Dust levels can indicate windiness and aridity in source regions
- Sea salt can reflect changes in winds, transport, and sea-ice related source processes, which makes it useful but not a one-to-one sea ice meter
- Sulfate spikes can reveal major volcanic eruptions
How far back do ice cores go in Greenland and Antarctica?
Time coverage depends on how fast snow accumulates, how thick the ice is, and whether the deepest layers have been deformed by ice flow and contact with bedrock.
Greenland
Greenland cores tend to have relatively high snowfall, which is great for detail and seasonal resolution. The tradeoff is that the total timeline is shorter than Antarctica’s deepest records.
- Many Greenland deep cores reach back roughly 100,000 to 130,000 years depending on the site and the core, which covers most or all of the last glacial cycle.
Antarctica
Antarctica has regions with very low snowfall but extremely thick ice. That combination can preserve a much longer history.
- Multiple Antarctic cores span hundreds of thousands of years.
- The longest widely used continuous Antarctic ice-core record reaches back to about 800,000 years so far.
That is an astonishing timescale. It means we can directly measure ancient CO2 and methane through many ice age cycles, not just infer them.
Why ice cores are so trusted, and what their limits are
Ice cores are beloved in climate science for a simple reason: they combine continuous layering with direct atmospheric sampling. Very few natural records do both.
Still, they come with caveats that scientists work hard to quantify:
- Gas-age versus ice-age mismatch: the air gets trapped after the snow falls, so timelines must be carefully aligned.
- Gas-age smoothing: because the firn mixes air before close-off, the bubble record represents a span of years rather than a single moment.
- Local versus global signals: isotopes mostly reflect regional temperature and circulation, not a perfectly global average. Antarctic temperature shifts, for example, are especially tied to Southern Ocean and high-latitude Southern Hemisphere conditions.
- Layer thinning with depth: deep layers get compressed and stretched by ice flow, which can blur fine details far back in time.
None of these issues are deal-breakers. They are the normal, solvable problems of doing science with real-world archives. And because ice cores overlap with other records, researchers cross-check them constantly.
Ice cores versus tree rings
If tree rings are a year-by-year diary of growing-season conditions on land, ice cores are a layered freezer archive that stores both temperature-sensitive water chemistry and ancient air from the atmosphere itself.
Quick questions I get a lot
Do ice cores prove today’s CO2 rise is unusual?
Ice cores show that for at least the last 800,000 years, atmospheric CO2 naturally cycled between roughly 180 and 280 parts per million as ice ages came and went. Modern measurements show CO2 has risen well above that range, and the increase has happened extremely fast compared with the natural swings seen in the ice.
How do scientists avoid contaminating the air bubbles?
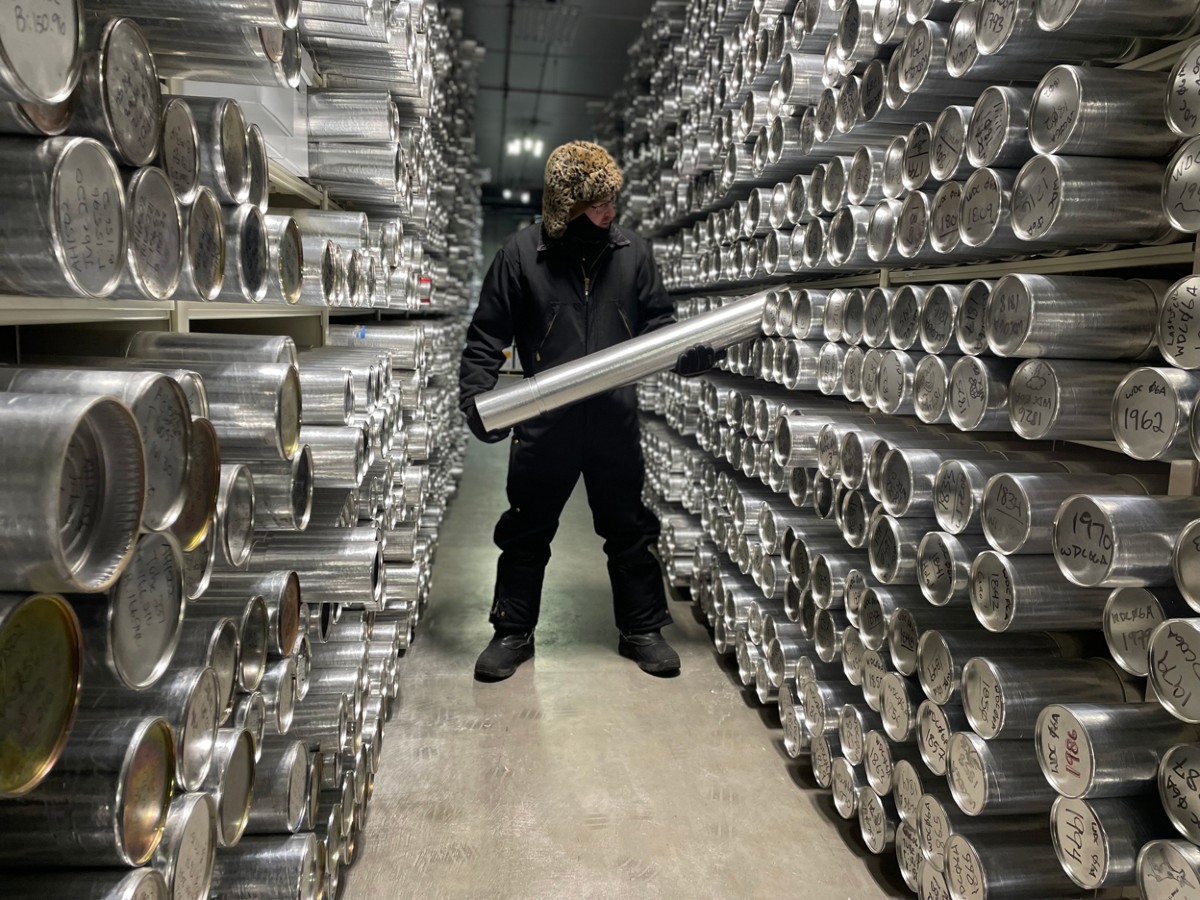
Cores are kept cold from the moment they are drilled through transport and storage. In the lab, researchers extract gases using controlled crushing or melting systems inside clean setups, then measure concentrations with precise instruments.
Can ice cores tell us about extreme weather?
Not like a modern weather station can, but they do preserve clues about shifts in storm tracks, wind-blown dust, sea ice, and abrupt climate jumps. They are especially good at capturing long-term context and sudden regional changes during the last ice age.